Introduction
Clinical trials, in the context of this report, are experiments designed and performed to evaluate the safety and efficacy of putative drugs.1,2 Assessing and managing clinical trial data brings unique challenges that require input from multiple technical disciplines and organizations. Medical monitors, medical writers, medical reviewers, data managers and biostatisticians from sponsors, CROs and regulatory agencies must work together to ensure that the trial is successful, and that the data are analyzed and managed correctly. Historically, data have been recorded and presented in widely different formats and with definitions that significantly inhibited the exchange and reuse of clinical trial data. As such, lack of data interoperability and the inefficiency to which it contributes have been considered barriers in translating promising discoveries into health improvements.3 These same challenges in semantic and syntactic interoperability have complicated regulatory review, necessitating the development of solutions to improve clinical trial data analysis processes.
CDISC: Foundation for Quality and Standardization
CDISC4 was founded as a non-profit organization in 2000 and, in the years since, has worked to advance interoperability in clinical trials through open and consensus-based data standards.
Standardization of clinical trial data helps ensure the precision and quality of data, potentially leading to reduced time and expense needed for drug development. Kush et al.5 pointed out in the early stage of CDISC development that “Use of CDISC standards at project initiation can save 70 to 90% of time and resources spent prior to first patient enrolled and approximately 75% of the non-patient participation time during the Study Conduct and Analysis stages.” These efficiencies, combined with the increased ability to directly probe, reanalyze, and reuse submitted data, are the reasons why regulatory agencies around the world are beginning to require the submission of data in CDISC standard.6
JMP® Clinical: Clinical Trial Evaluation Based on CDISC Data
JMP® Clinical,7 a dedicated clinical trial software, was first released in 2010 in response to requests from the United States Food and Drug Administration (FDA) and the clinical trial industry. The CDISC standard makes software development much faster and increases the efficiency of the analysis procedure and results presentation because all the domains and variables share common definitions.
The CDISC standard not only modernizes clinical trial data submission, but also provides the foundation to streamline and standardize the clinical trial data collection, analysis, and management process. With well-defined variables, data formats, and domains in CDISC, both researchers and software systems know where, what, and how to utilize variables to assess the safety and efficacy of the drug more accurately, efficiently, and effectively. CDISC standardized data is a foundation for building intelligent software that supports the streamlined review of safety and efficacy clinical trial data. CDISC standardized data, when used in combination with other guidelines such as: International Council for Harmonisation of Technical Requirements for Pharmaceuticals for Human Use (ICH) E3 guidelines,8 The Journal of the American Medical Association (JAMA) presentation rules for authors,9 RECIST guidelines,10 makes it possible for JMP® Clinical software, to summarize clinical trial data. This summary can include common demographic subgroups, protocol-defined subgroups and comparisons between groups for per-protocol and Intent To Treat (ITT) subsets of study subjects, without ad hoc programming, while retaining its unique interactive visualization capability. Modern software with interactive graphics and interactive filters allows researchers to dig deep into their results, to summarize information more quickly, and to more easily understand patterns and trends and their connection to drug safety easier.
Regulatory Agencies: Reassuring Standards for Enhancing Clinical Trial Reviewing
CDISC initially chose to use the SAS transport file as the storage format for their Submission Data Tabulation Model (SDTM, then called the Submission DataSet or SDS), Standard for the Exchange of Nonclinical Data (SEND), and Analysis Data Model (ADaM) as the use of SAS was nearly universal in the pharmaceutical industry and at the FDA, according to a short history of CDISC and SAS transport files on the CDISC website.11 At the same time, the FDA promoted the transition from paper to electronic data submission. FDA required submitted data to be in the SAS version 5 transport file format for each domain (e.g., demographics, adverse events), serving as a precursor to CDISC domains/datasets since 2004.12 The China National Medical Products Administration (NMPA)13 and the Japan Pharmaceuticals and Medical Devices Agency (PMDA)14 also required the SAS transport file as the format for data submission. Since 2016, the FDA15,16 and PMDA14,17 have required, and the NMPA18 and Europe European Medicines Agency (EMA)19 have recommended, CDISC format for clinical data submission.
In 2011, the FDA released a report with an evaluation of JMP®20 and JMP® Clinical as tools for FDA reviewers.21 This Assessment of the Impact of the Electronic Submission and Review Environment on the Efficiency and Effectiveness of the Review of Human Drugs – Final Report indicated JMP® 7.0 was already being used by the FDA at that time, and JMP® Clinical was listed as being under pilot testing at the Center for Drug Evaluation and Research (CDER) and the Center for Biologics Evaluation and Research (CBER).21 In 2018, the FDA revised its procedures for CDER Medical Officer Conversion to Career-Conditional.22 This document lists the required training courses for reviewers to convert “from the medical officer temporary appointment of level 1, associate reviewer, to the career conditional appointment of level 2, reviewer”. The required training included the Medical Dictionary for Regulatory Activities (MedDRA)23 for medical terminology, CDISC for Data standards, and JMP® and JMP® Clinical training with multiple models for the standard analysis procedures. The PMDA also acknowledged that JMP® and JMP® Clinical were used in their review teams in 2015.24 Finally, the EMA announced in the regulatory session of CDISC Europe Interchange 2022 that they are evaluating JMP® Clinical as visualization software.25
Many reviewers and researchers prefer to analyze the data themselves, and this requires software that can perform the analysis and integrate with the terminology of the data standards. Manually reviewing the results can involve several tedious and repetitive steps, including summarizing the count and frequency of demographics, events, and interventions, calculation of risk differences across treatment groups, and examination of data over time for all participants and at the patient level. In addition, manual generation of Adverse Event (AE) narratives often requires significant effort on the part of the medical reviewers and writers. The CDISC data standard enables software, like JMP® Clinical and other tools to reduce the tedious and repetitive manual work and automatically generate the analysis results in a standardized presentation. The standardized presentation further improves efficiency, ensures quality, and provides for effective communication of the trial results and analyses.
In this paper, we discuss clinical trial summary information and follow the flow of FDA New Drug Application (NDA) submissions, Clinical Reviews (CR) and Biosimilar Multi-disciplinary Evaluation and Review (BMER) to reveal how the various domains of SDTM and ADaM are used to assess drug safety.
FDA Drug Safety Evaluation in NDA and CRs
Data for Demonstrating JMP® Clinical Use In a Regulatory Review
Nicardipine hydrochloride, a calcium channel blocker, is used to treat high blood pressure, angina, and congestive heart failure. A randomized clinical trial was performed to assess whether nicardipine could benefit patients who experienced a subarachnoid hemorrhage (SAH, bleeding in the space that surrounds the brain).26,27,28 Patients were dosed with either intravenous nicardipine (NIC.15) or placebo for up to 2 weeks with the goal of reducing the incidence of SAH. Parts of this Nicardipine clinical trial data were deidentified and converted to CDISC format including both ADaM (ADSL, the subject-level dataset) and SDTM domains (DM (demography), AE (adverse events), CM (concomitant medications), DS (disposition), EG (electrocardiogram), EX (exposure), LB (laboratory test results), MH (medical history), SV (subject visits) and VS (vital signs)). This deidentified Nicardipine data is used to illustrate examples throughout this paper. Specific report names from JMP® Clinical are indicated in italics.
Data Import, Analysis and Presentation
JMP® Clinical needs only a study name and the location of the SDTM, or ADaM domain files to add the study and capture all its information. The software imports all data, assesses availability of domains and variables, generates metadata to manage the study, defines the settings, preferences, and metadata, and creates interactive drug safety/efficacy and data quality reports without programming (Figure 1). The results can be explored at the study levels, sub-grouped by filters and at the subject level in detail with a few mouse clicks. The results are presented in the interactive plots and tables following ICH guidance7 and JAMA rules8 for clinical trial data and analysis results presentation.
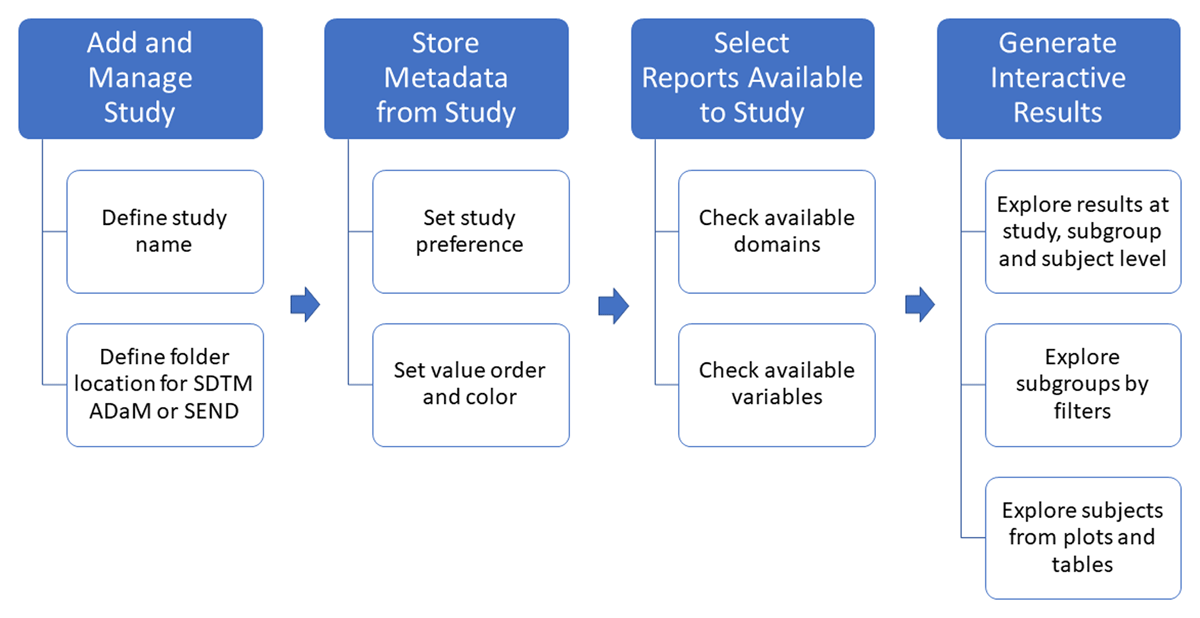
Typical Analysis/Review: This flow diagram illustrates the steps in a typical analysis/review of clinical trial data.
Trial Summaries
A Study flow diagram (SFD) can be automatically created from imported CDISC data to summarize the overall clinical trial data flow (Figure 2). The diagram of the Nicardipine trial starts with 906 subjects assessed for eligibility. Four subjects failed preliminary screening according to the DM domain. The 902 remaining subjects were randomized and divided into two groups, based on the DS domain, to extract protocol information for disposition events and epochs (e.g., on-treatment and follow-up) presented in the study: 447 subjects in the treatment group (NIC. 15) and 455 subjects in the placebo group. Treatment and placebo groups have similar disposition events: Completed (357 and 363); death (80 and 81) and lost to follow-up (10 and 11). The CDISC variable DSDECOD is used primarily to calculate the number of disposition events per subgroup of interest. SFD can also extract information from the EX domain and Subject Level Analysis Dataset (ADSL).
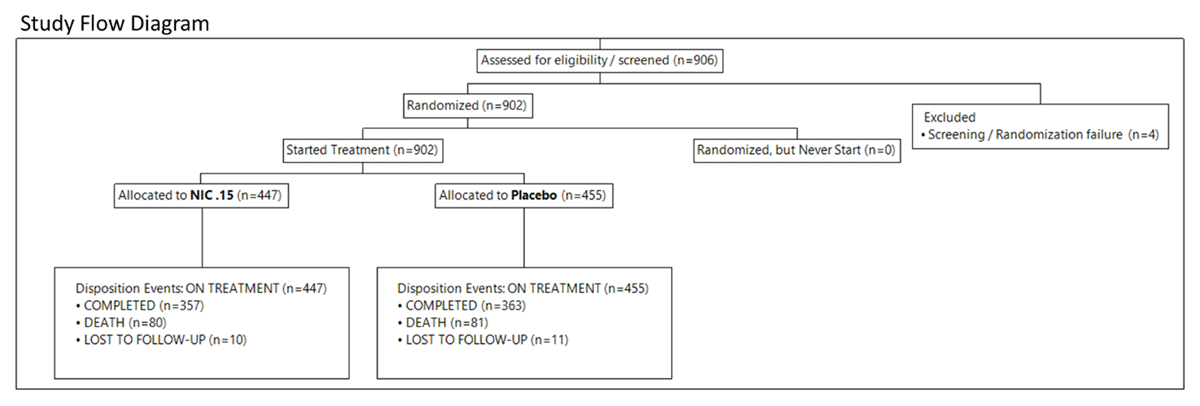
Study Flow Diagram: This diagram illustrates the paths that subjects in the Nicardipine study took through the clinical trial.
To understand overall event distribution, an event summary is generated according to the CDISC variable DSTERM in the DS domain using the Event Distribution report, showing the subject number and percentage for each group and for the total for each disposition event (Table 1). Along with typical disposition events such as randomized, completed, and lost to follow-up are the Date of SAH, and Glasgow Outcome Scale categories: recovery, death, moderately disabled, severely disabled, and vegetative survival.
Disposition of Participants in the Nicardipine Trial.
| Standardized Disposition Term | Planned Treatment for Period 01 | ||
|---|---|---|---|
| Placebo | NIC .15 | Total | |
| (N = 455) | (N = 447) | (N = 902) | |
| n (%) | n (%) | n (% of Total) | |
| DATE OF SAH | 455 (100.0) | 447 (100.0) | 902 (100.0) |
| RANDOMIZED | 455 (100.0) | 447 (100.0) | 902 (100.0) |
| COMPLETED | 363 (79.8) | 357 (79.9) | 720 (79.8) |
| RECOVERY | 255 (56.0) | 244 (54.6) | 499 (55.3) |
| DEATH | 81 (17.8) | 80 (17.9) | 161 (17.8) |
| MODERATELY DISABLED | 55(12.1) | 55 (12.3) | 110(12.2) |
| SEVERELY DISABLED | 32 (7.0) | 38 (8.5) | 70 (7.8) |
| LOST TO FOLLOW-UP | 21 (4.6) | 25 (5.6) | 46 (5.1) |
| VEGETATIVE SURVIVAL | 13(2.9) | 5(1.1) | 18(2.0) |
Occurrence of Treatment Emergent Adverse Events Among Participants in the Nicardipine Trial.
| Treatment Emergent Categories | Planned Treatment for Period 1 | |
|---|---|---|
| Nic .15 (N = 447) | Placebo (N = 455) | |
| N (%) | N (%) | |
| Subject with any TEAE | 420(94.2) | 421 (92.3) |
| Subject with severe TEAE | 112(25.1) | 138(30.3) |
| Subject with any Treatment Emergent SAE | 112(25.1) | 138(30.3) |
| Subject with any Treatment Emergent Adverse Events Leading To Death | 67(15.0) | 64(14.1) |
| Subject with any Treatment Emergent Adverse Events Leading To Permanent Treatment Discontinuation | 135(30.2) | 93 (20.4) |
To determine whether adverse events occur on or after the date that the intervention began, the treatment emergent adverse events (TEAEs) were further summarized with the number and percent of subjects in the treatment groups for any TEAE, severe TEAE, emergent SAE, TEAEs leading to death, and discontinuation according to the AE domain.
Review of Safety – Common FDA NDA and CR Procedures
We use a variety of FDA documents, NDAs,29,,31,32,33,34 CRs35,36,37,38,39,40 and Biosimilar Multidisciplinary Evaluation and Review (BMER)41 to discuss how CDISC-formatted data can be used effectively to review and analyze the safety of new drugs. A common workflow for evaluating drug safety in FDA documents is outlined in Sections A to G below.
-
Safety Review Approach
This section includes a statement regarding what the safety evaluation is based on, which treatment arms are important and what methods were employed to assess safety. For example, the NDA Vyvanse®,29 included the data format and software used as follows: “The Analysis Data Model (ADaM) and Study Data Tabulation Model (SDTM) datasets were intact and evaluable using JMP® programs for the clinical team and for evaluation by our Biometrics team”.
-
Review of Safety Database
This section includes summary statements and a review of overall exposure to the study drug and assessment of the adequacy of the safety database including characteristics of the safety population. CR Latuda®35 used Demographics Distribution to understand the demographic characteristics of the safety database. CR Vfend®36 shows multiple treatment exposure tables generated by JMP®.
-
Adequacy of Applicant’s Clinical Safety Assessments
This section provides a series of general statements regarding the safety assessments performed in the trial. They include comments on data integrity and quality of the NDA or CR submission, categorization of adverse events and comments on routine clinical tests.
-
Safety Results:
This is the major section in the safety review. It contains multiple aspects:
-
Death and Serious Adverse Event (SAE):
An important part of any safety review is to examine any deaths or SAEs that occur during the study to determine if they were caused by the study treatment. In the CR Latuda®,35 each subject with SAEs was described in detail in narratives generated by Adverse Events Narrative in JMP® Clinical that uses the AE domain as the basis of these narratives with options to include information from other domains, such as EX, CM, LB, etc., and switch event types, such as to Treatment Emergent Events (Figure 3A). To create narratives for those subjects who experienced an SAE only, for example, JMP® Clinical uses the Serious Event variable (AESER or AETOXGR) from the AE domain. In addition, Narratives can be in English or Chinese and can be displayed in different formats by modifying the underlying template. Subjects can be explored further in JMP® Clinical with Patient Profiles, which graphically display the patients’ data over time (Figure 3B). To visually see if SAEs are related to the study drug, Adverse Event Distribution can be used to compare SAEs in different treatment groups in either a table, as in the NDA Twyneo®,30 or in a bar chart colored by selecting causality in the stack function (Figure 4B).
-
Discontinuations Due to AEs
Discontinuations due to AEs are often compared between treatment and placebo using subject count and percentage to determine which group has a higher occurrence. In the NDA Twyneo®,30 the Treatment-Emergent Adverse Reactions leading to Discontinuation table was generated by Adverse Event Distribution. To get this table, the report was dynamically filtered on the Safety population and treatment emergent events, as well as Action Taken with Study Treatment (AEACN) and Causality (AEREL) variables to get only AEs with an action of DRUG WITHDRAWN and a causality of PROBABLY or DEFINITELY related to study drug.
-
Common Treatment Emergent Adverse Events (TEAEs)
Reviewers investigate TEAEs to determine which AEs are more frequently associated with drug treatment. In the CR Adhansia XR®,37 a table of TEAEs with occurrence greater than 2% was generated using the Adverse Event Distribution report with Dictionary-Derived Term (AEDECOD) as the term and group levels. Similar plots and tables were generated for the Nicardipine data (Figure 4). Figure 4A shows the occurrence of all TEAEs while Figure 4B shows a subset that includes the most common TEAEs with outcome as NOT RECOVERED/NOT RESOLVED colored by causality (Figure 4B). TEAEs are determined by a treatment emergent flag, typically TRTEMFL in ADaM or AETRTEM in SDTM, or by comparing the treatment dates and the date of the start of the adverse event using variables such as TRTSDT from ADSL and AESTDTC from AE.
-
Significant AEs
Reviewers normally investigate the occurrence of AEs to evaluate their relationship to specific subgroups, usually the treatment group. Examples of tables and figures with AE count and percent generated by JMP® Clinical for significant AEs can be found in the NDA Dupixent®31 and the CR Spiriva Respimat®.38
The forest plot is a popular visual approach to assess the risk of AE generated by Adverse Events Risk Report as shown in Figure 5. The overall risk of AEs (Figure 5A) can be filtered by risk difference to reveal significantly different AEs between the treatment groups as shown in Figure 5B, along with the corresponding table shown below with the total and percent of the count. The Medical Query Risk Report can be used to further look at these safety signals using adverse events and corresponding medical queries. The report displays a forest plot for either standardized medical queries (SMQ)23 or FDA medical queries (FMQ)42 along with a confidence interval to help visually detect significant safety signals. The report can be configured to up to four tables of counts and percentages for narrow or broad medical queries with contributing dictionary-derived terms under each query, medical queries by scope (broad or narrow), and system organ class with contributing medical queries under each system organ class. The report uses the dictionary-derived term (AEDECOD) from the AE dataset and groups them into medical queries using ASCII files, commonly provided by MedDRA as shown in Figure 5. In CR Zegalogue, 39 a table was created by JMP® with FMQ to query for potentially meaningful safety signals.
-
Laboratory Findings:
Lab measurements can be used to assess drug efficacy and safety by comparing findings in the treatment and placebo groups. If researchers have not targeted specific laboratory test measurements to investigate, they can use Findings ANOVA to determine which test results show statistically significant differences in measurement values between groups. As shown in Figure 6A, BUN (Blood Urea Nitrogen) has the second highest -logP value (y-axis) and the largest difference between treatment and placebo groups (x-axis). The high BUN values were of interest to the researchers of nicardipine as it seemed to contribute to azotemia and was a risk factor for sepsis with some of the patients on nicardipine.26–28 Findings Distribution was used to further investigate the difference between NIC.15 and placebo groups for BUN (Figure 6B). A similar analysis in the CR Repatha®40 showed the difference between the groups for Vitamin K level. Potentially significant laboratory measurements such as BUN for nicardipine can also be compared between the treatment groups at each visit for reference range indicator (Figure 6C), mean measurement changes according to time trend (Figure 6D) and baselines (Figure 6E) that are generated by the Findings (LB) Distribution, Findings Time Trends and Findings Box Plots reports, respectively. Other findings domains such as VS and EG, etc. can also be used when the domain data is available.
Specialized views of laboratory findings domain information are also used to perform Hy’s law analysis to detect drug-induced liver injury (DILI) (data not shown).
-
-
Analysis of Submission-Specific Safety Issues:
Prospective drugs can have their own individual safety issues. In the NDA Mydayis®,32 drug-induced insomnia was a particular concern. In this case, changes in minutes required for falling asleep and sleep length for the subjects in the treatment group relative to the placebo group were investigated using Findings Distribution (similar to Figure 6B).
-
Safety Analyses by Demographic Subgroups:
Safety analyses by demographic subgroup results are often listed as AE counts and percentages. The NDA Arazlo®33 used Adverse Event Distribution to generate multiple tables for the subgroups such as age, gender, race, ethnicity, and location. The table can also be complemented by a distribution plot. With the filter, different subgroups can easily be toggled, and colored by different adverse events at the same time for table and plot.
In the NDA Mydayis®,32 a time-trend plot like Figure 6D which showed the weight change between visits for the different age groups was generated by the Findings Time Trend report with VS domain.
-
Specific Safety Studies/Clinical Trials and Additional Safety Explorations
In the NDA Vyvanse®,29 the reviewer used box plots as shown in Figure 6E to display the changes in weight and BWI according to drug dose to address concerns about the effect of Vyvanse® on growth. The reviewer also employed the time-trend plot as shown in Figure 6D to illustrate the change in height over the visit for the participants.
FDA clinical reviewers also used JMP® and JMP® Clinical to verify the results in CSRs from sponsors’ submissions as shown in the NDA Quzyttir®34 and BMER AvsolaTM.41
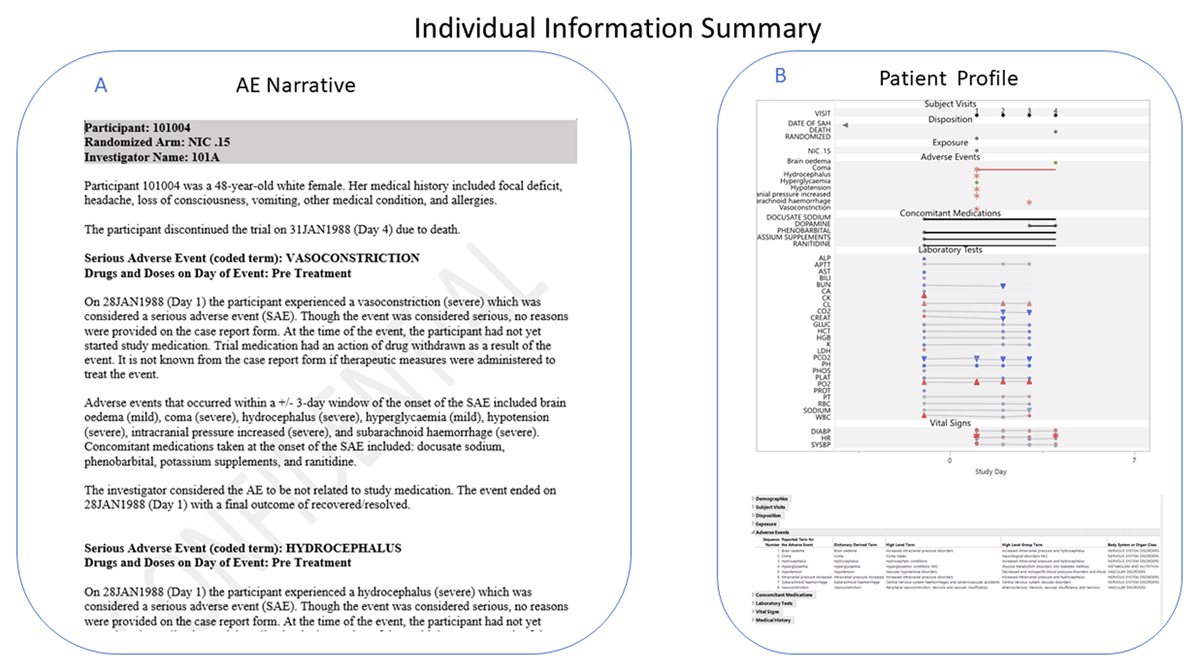
Summarizing subject-level information: A. Narrative. A summary description of the adverse events the subject experienced over the course of the study. B. Patient Profile. A graphical representation of the disposition, exposure, adverse events, medications, and findings by visit the subject experienced over the course of the clinical trial.
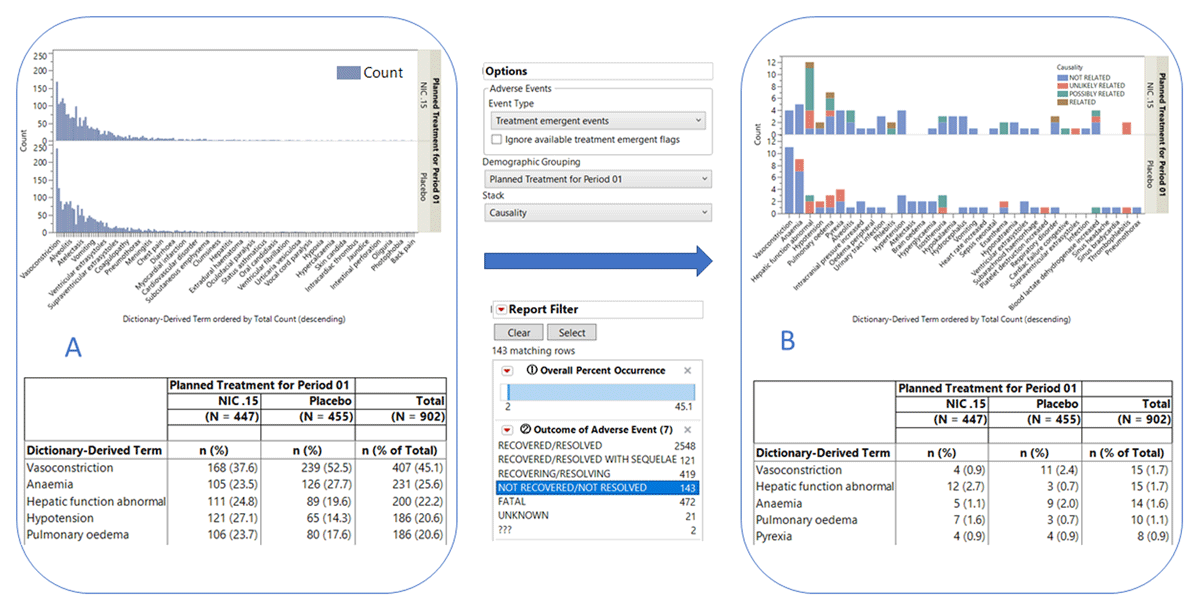
Exploring Common TEAEs. This figure shows the results of a typical exploration of common (>2%) TEAEs. A. Bar chart (top) and corresponding summary table (bottom) showing the occurrence of all the TEAEs observed in the study participants. B. Bar chart (top) and corresponding summary table (bottom) showing the occurrence of the most common TEAEs (>2%) not recovered or not resolved among subjects in the treatment ARM. Bars are colored by causality status.
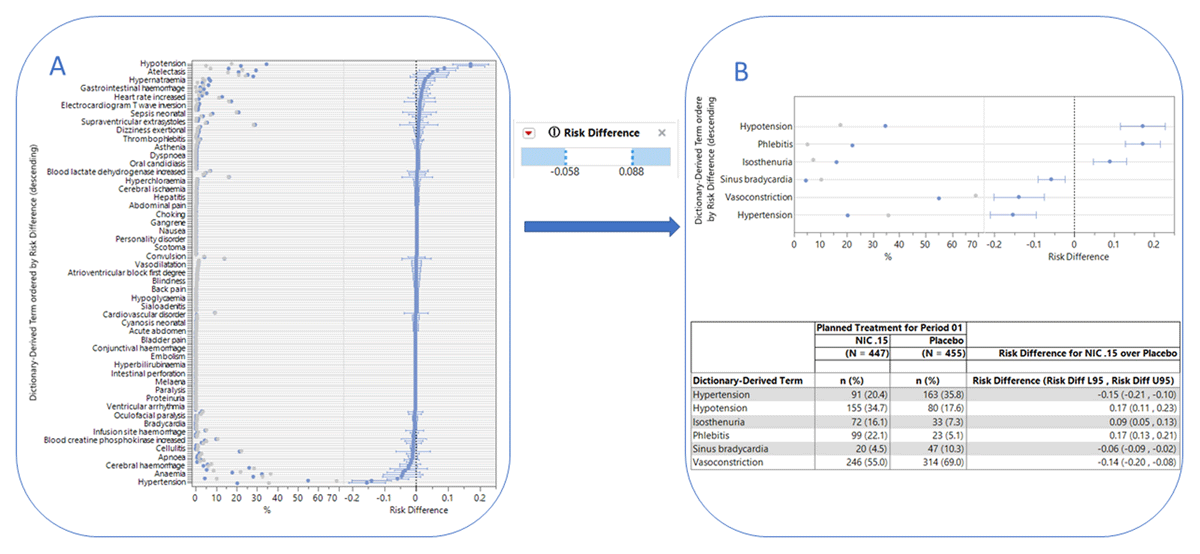
Risk Assessment. Forest plots showing AEs that are significantly different between the treatment groups. The graphic at left shows a forest plot for each medical query along with a confidence interval to help visually detect these safety signals. The graphic at right consists of plots showing AEs that are significantly different (as determined using the filter option (center) between the treatment groups. The corresponding table is shown below with the total and percent of the count, plus risk difference.
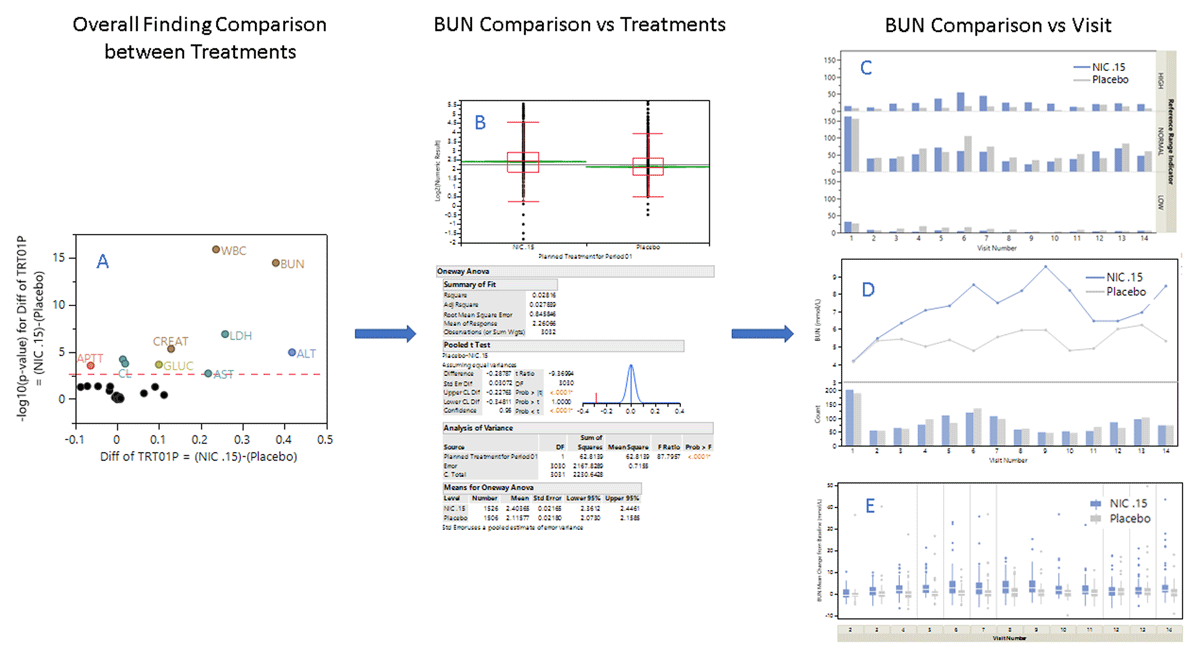
Laboratory Findings. Identification and investigation of significant findings results. A. Volcano plot showing significant differences in findings between treatment groups in the Nicardipine study. B. Comparison of blood urea nitrogen levels (BUN) between treatment groups. The box plot (top) shows the distribution of BUN levels among subjects in each treatment group. Oneway ANOVA (bottom) explores the significance of the difference. C-E. Comparison of treatment groups per visit for (C), reference range indicator, (D) mean measurement changes according to time trend, and (E) baselines.
Therapeutic Assessment
Therapeutic area CDISC domains such as tumor domains, equip researchers to quickly identify efficacy signals in solid tumor clinical trials and determine whether subjects show complete response, partial response, progressive disease, or stable disease. Disease Response Swimmer Plots and Progression Free Survival reports are industry standard visualization and analysis techniques that follow the published rules by Response Evaluation Criteria in Solid Tumors (RECIST)9 to define patient overall response. An additional Tumor Response shows a collection of criteria from many different domains on the same timeline as the disease progression through the trial (Results not shown).
Discussion
To provide real-world examples of clinical trial data, a modified Nicardipine study was used to demonstrate the analysis throughout the paper. Custom CDISC domains, therapeutic area domains and supplemental qualifiers for different clinical trial studies can be recognized by JMP® Clinical and data analysis and management can be evaluated accordingly. This paper also follows the FDA NDA or CR’s Review of Safety template to illustrate how safety can be reviewed with JMP® Clinical analysis results.
The clinical trial data assessment can begin with a high-level summary of the study. The first study level summary is a study flow diagram that enables visualization of the patients as they move through the different phases of the trials. Overall summaries of events and TEAE’s in tabular and graphical format are helpful for understanding how the trial was executed and what occurred during the study.
Group comparisons, such as between treatment arms, doses, and demographic groupings such as sex or age groups, can be performed for specific interested groups such as SAE, common TEAE, different outcome groups etc. detailed in FDA documents.29,30,31,32,33,34,35,36,37,38,39,40,41 Events can be combined with standard terms from MedDRA29,35,36 and FDA medical queries,39 used in NDAs and CRs, to allow the examination of multiple-term levels to discern the AE patterns by groups and by timing. Findings allow researchers to quickly identify potentially harmful medical complications, including liver toxicity, that develop during the clinical trial, compare the means of the laboratory or vital sign results, and utilizing visual and algorithmic outlier detection methods.
JMP® Clinical generates individual information summaries such as AE narratives43 and patient profiles44 using various CDISC domains. AE narratives collect information about demographics, disposition, adverse events, exposure, concomitant medications, and findings and automatically generate a descriptive, easy-to-read summary of relevant clinical information for each participant. For example, it took JMP® Clinical less than one minute to generate an AE narrative for over 900 Nicardipine study subjects. Narratives allow customization using templates for subjects, ICHE 3 category, and event levels, depending on the medical writers’ needs. Patient profiles use the same information to generate a single plot to summarize the clinical results according to the study day of the visits. Patient profiles are customizable to display domain data order and content.
Going one step further, all of the analysis and review results generated by an individual or team of reviewers can be easily shared in JMP®Live,45 a generator of web-based interactive reports. This functionality of JMP® Live removes the barriers of space and time and fosters a simple and efficient interactive environment in which geographically diverse colleagues can share the same client-generated results to draw inferences much more effectively as a community of researchers.
Embedding logical rules and algorithms for data analysis, can help to accommodate unique circumstances of the data. For example, if the date of first exposure to the drug (DM variable RFXSTDTC), is missing, the algorithm might next search the EX domain for the earliest EXSTDTC. For ongoing trials, if neither of these variables is populated, the DM variable RFSTDTC is used. This type of logic, utilized through JMP® Clinical, makes data analysis easy for less-than-perfect CDISC data and useful for academics, sponsors, and regulatory agencies. Including these features in interactive software allows reviewers the flexibility and freedom to easily explore and answer relevant questions about a study.
This paper has demonstrated that standardized data (CDISC), and standardized terminology (FMQ and SMQ) can lead to an automated analysis by software (JMP® Clinical) with standardized and interactive tables and figures following regulatory agency and industry-recognized guidance and rules.7,8,9 Since JMP® Clinical is based on CDISC, JMP® Clinical can adopt new guidelines quickly for adding FMQ42 as the default option for the Medical Query Risk Report and creating a new Algorithmic FDA Medical Query Risk Report. Comparison of FMQ and SMQ results offers a new explore strategies for adverse events. In addition, JMP® Clinical can align all its tables and figures in content and style with the new FDA Standard Safety Tables and Figures: Integrated guide with easy, thanks CDISC standard data.46 The standardized data, terminology and analysis procedures will enhance efficiency to make sure the data and analysis procedure with high quality, reproducibility, and reusability. Therefore, reducing the cost of clinical trials, streamlining the process, and improving communication among different parties involved in clinical trials become possible.
Competing Interests
The authors have no competing interests to declare.
References
1. Meldrum ML. A brief history of the randomized controlled trial. From oranges and lemons to the gold standard. Hematol Oncol Clin North Am. 2000; 14(4): 745–vii. DOI: http://doi.org/10.1016/S0889-8588(05)70309-9
2. Bothwell LE, Podolsky SH. The Emergence of the Randomized, Controlled Trial. N Engl J Med. 2016; 375(6): 501–504. DOI: http://doi.org/10.1056/NEJMp1604635
3. Austin CP. Opportunities and challenges in translational science. Clin Transl Sci. 2021; 14(5): 1629–1647. DOI: http://doi.org/10.1111/cts.13055
4. CDISC: https://www.cdisc.org/.
5. Kush RD, Bleicher P, Kubick WR, Kush ST, Marks R, Raymond SA, Tardiff B. eClinical Trials:Planning and Implementation. 2003. ISBN-13: 978-1930624283.
6. Slack MA, Fitzmartin R. Electronic Submissions -The Requirement for Standardized Study Data. 2015. https://www.fda.gov/media/91152/download.
7. JMP® Clinical: https://www.jmp.com/clinical.
8. ICH 3 Guideline for Industry Structure and Content of Clinical Study Reports. https://www.fda.gov/media/71271/download.
9. JAMA. Instructions for Authors: https://jamanetwork.com/journals/jama/pages/instructions-for-authors.
10. Eisenhauer EA, Therasse P, Bogaerts J, et al. New response evaluation criteria in solid tumours: revised RECIST guideline (version 1.1). Eur J Cancer. 2009; 45(2): 228–247. DOI: http://doi.org/10.1016/j.ejca.2008.10.026
11. A Short History of CDISC and SAS Transport Files. https://www.cdisc.org/kb/articles/short-history-cdisc-and-sas-transport-files.
12. United States Food and Drug Administration (FDA). Electronic Submission File Formats and Specifications, Revision 3, 2021. https://www.fda.gov/media/12F2970/download.
13. China NMPA eCTD Verification standard, 2021 https://www.nmpa.gov.cn/directory/web/nmpa/images/1632971770483052749.pdf.
14. Japan PMDA Revision of Technical Conformance Guide on Electronic Study Data Submissions, 2019. https://www.pmda.go.jp/files/000229468.pdf.
15. FDA. Providing Regulatory Submissions In Electronic Format —Standardized Study Data Guidance for Industry. 2021 https://www.fda.gov/media/82716/download.
16. FDA. Study Data Technical Conformance Guide 2022 https://www.fda.gov/media/153632/download.
17. Japan PMDA Revision of Basic Principles on Electronic Submission of Study Data for New Drug Applications, 2020. https://www.pmda.go.jp/files/000234977.pdf.
18. China NMPA Guidance Principles of Electronic Data Acquisition Technology for Clinical Trials. 2016. https://www.nmpa.gov.cn/directory/web/nmpa/xxgk/ggtg/qtggtg/20160729184001958.html.
19. Europe EMA Reflection paper on expectations for electronic source data and data transcribed to electronic data collection tools in clinical trials, 2010. https://www.ema.europa.eu/en/documents/regulatory-procedural-guideline/reflection-paper-expectations-electronic-source-data-data-transcribed-electronic-data-collection_en.pdf.
20. JMP®: https://www.jmp.com/.
21. FDA Assessment of the Impact of the Electronic Submission and Review Environment on the Efficiency and Effectiveness of the Review of Human Drugs – Final Report. 2011 https://www.fda.gov/files/about%20fda/published/Assessment-of-the-Impact-of-the-Electronic-Submission-and-Review-Environment-on-the-Efficiency-and-Effectiveness-of-the-Review-of-Human-Drugs-%E2%80%93-Final-Report.pdf.
22. FDA Procedures for CDER Medical Officer Conversion to Career-Conditional 2018 https://fda.report/media/80047/Procedures-for-CDER-Medical-Officer-Conversion-to-Career-Conditional.pdf.
23. Medical Dictionary for Regulatory Activities (MdeDRA). https://www.meddra.org/.
24. Ando Y. CDISC Implementation in PMDA 2015 https://www.pmda.go.jp/files/000208574.pdf.
25. Psarelli E. EMA Update on Submission of Individual Patient Data from Clinical Trials. 2022. https://www.cdisc.org/events/interchange/2022-europe-interchange/archive.
26. Haley, EC Jr, Kassell NF, Torner JC. A randomized trial of nicardipine in subarachnoid hemorrhage: angiographic and transcranial Doppler ultrasound results. A report of the Cooperative Aneurysm Study. J Neurosurg. 1993; 78(4): 548–553. DOI: http://doi.org/10.3171/jns.1993.78.4.0548
27. Haley, EC Jr, Kassell NF, Torner JC, Truskowski LL, Germanson TP. A randomized trial of two doses of nicardipine in aneurysmal subarachnoid hemorrhage. A report of the Cooperative Aneurysm Study. J Neurosurg. 1994; 80(5): 788–796. DOI: http://doi.org/10.3171/jns.1994.80.5.0788
28. Haley, EC Jr, Kassell NF, Torner JC. A randomized controlled trial of high-dose intravenous nicardipine in aneurysmal subarachnoid hemorrhage. A report of the Cooperative Aneurysm Study. J Neurosurg. 1993; 78(4): 537–547. DOI: http://doi.org/10.3171/jns.1993.78.4.0537
29. FDA. New Drug Application (NDA) Vyvanse. 2021. https://www.fda.gov/media/151943/download
30. FDA. NDA Twyneo. 2021. https://www.fda.gov/media/151645/download.
31. FDA. NDA Dupixent. 2021. https://www.fda.gov/media/155349/download.
32. FDA. NDA Mydayis. 2019. https://www.fda.gov/media/142063/download.
33. FDA. NDA Arazlo. 2019. https://www.fda.gov/media/134644/download.
34. FDA. NDA Quzyttir. 2019. https://www.fda.gov/media/133034/download.
35. FDA. CR Latuda. 2018. https://www.fda.gov/media/103749/download.
36. FDA. CR Vfend. 2017. https://www.fda.gov/media/113616/download.
37. FDA. CR Adhansia XR. 2019. https://www.fda.gov/media/124188/download.
38. FDA. CR Spiriva Respimat. 2017. https://www.fda.gov/media/103941/download.
39. FDA. CR Zegalogue. 2021. https://www.fda.gov/media/147791/download.
40. FDA. CR Repatha. 2021. https://www.fda.gov/media/154402/download.
41. FDA. BMER Avsola. 2019. https://www.fda.gov/media/134460/download.
42. FDA. Medical Queries (FMQ); 2022. https://www.regulations.gov/document/FDA-2022-N-1961-0001
43. Ledade SD, Jain SN, Darji AA, Gupta VH. Narrative writing: Effective ways and best practices. Perspect Clin Res. 2017; 8(2): 58–62. DOI: http://doi.org/10.4103/2229-3485.203044
44. FDA Patient Profile Viewer; Notice of Pilot Project https://www.govinfo.gov/content/pkg/FR-2001-12-10/pdf/01-30430.pdf.
45. JMP® Live https://www.jmp.com/en_us/software/collaborative-analytics-software.html
46. FDA Standard Safety Tables and Figures: Integrated Guide 2022 https://www.regulations.gov/document/FDA-2022-N-1961-0046.