
Introduction
Over the last decade, regulatory and industry standards for clinical trial conduct have shifted from requiring 100% verification of data at a clinical investigator site to a focus on a risk-based approach that manages clinical operations with greater efficiency, leading to both greater quality and lower cost outcomes.
During this period, several regulatory agencies released guidance documents that address a fundamental change in how new therapeutic solutions are developed and delivered to patients. In 2007, the US Food and Drug Administration’s (FDA) Dr Janet Woodcock announced an increased focus on risk-based approaches in Good Clinical Practice (GCP).1 In 2009, the Clinical Trials Transformation Initiative (CTTI) was formed, and later released the Quality by Design Metrics Framework.2 Following this, the FDA, European Medicines Agency (EMA), and TransCelerate BioPharma released guidance documents on risk-based monitoring and risk-based quality management.3,4,5 More recently, the International Council for Harmonization, in the E6(R2) addendum, has provided guidelines for the application of a risk-based approach to conduct and monitoring, with a focus on subject safety as well as the efficacy outcome of clinical trials.6 The industry is steadily implementing the prescribed processes, systems, and teams to align to the new ways of working. The concept of Source Data Verification and Review (SDV/SDR) as the sole indicator of data quality has been challenged by regulators’ focus on risk management principles.
In addition, the COVID-19 pandemic forced sponsors and Clinical Research Organizations (CROs) to evaluate and adjust their approaches for engaging with clinical investigator sites. The pandemic has forced the use of modern techniques such as using central statistical surveillance to ensure data quality and accuracy, changing how direct investigator site engagement is conducted, as well as relying on additional methods such as remote contact, to the forefront of monitoring activities.
Changes to the regulatory and external environments, precipitated by the pandemic, have stressed the clinical research model, forcing clinical research to adopt a new operating model in a response. When faced with a changing regulatory environment and extraneous factors such as a global pandemic, the discussion for adopting to a new reality should be framed in terms of changing both business and operating models. A business model is defined as how value is created and captured. The operating model organizes the assets of the organization to build capability, act, and deliver and capture value created by the business model.7,8
The value created by pharmaceutical Research and Development (R&D) is by delivering new therapeutic solutions for unmet medical need to patients in a regulated environment.
Traditional approaches to managing timelines, cost and quality are no longer adequate.
Traditional clinical operation analytics rely on static lagging indicators drawn from different transactional and clinical systems, often siloed, to gauge the health of trials and investigator sites.9 Operational and clinical data, and their associated analytics, are rarely organized coherently enough to provide meaningful and timely insights about site and trial management personnel.
This therefore represents an opportunity to evaluate emerging technologies, including automation and advanced dynamic analytics (predictive and prescriptive modeling) approaches, in supporting proactive issue identification and reducing regulatory risk and the effort required for regulatory compliance.
A dynamic monitoring approach leverages data from integrated predictive analytics to assess the trajectory of leading indicators of quality, risk and workload to facilitate optimized decision making. Dynamic monitoring moves resource management in clinical operations away from formula-driven, deterministic planning to a more stochastic prediction that allows deployment of resources where and when they are needed.
Rolling out a full analytics program should follow an analytical maturity model framework. In this context, analytics advance from current descriptive and diagnostic reports, which rely on static Key Risk and Performance Indicators (KRI/KPI) and metrics to predictive algorithms that further quantify future risk and workload. This further matures to prescriptive approaches that inform the teams when to take action.
To meet the challenges posed by a changing environment and to manage the pressures on clinical operations, Janssen R&D has developed and implemented a comprehensive dynamic monitoring solution that uses a harmonized approach to data ingestion, integration, modeling, and analytics including predictive modeling. The implemented solution is an analytics platform that receives inputs from several different systems, while connecting different roles with access to shared metrics and analytics.
This was a multi-year endeavor with participation across many clinical operations functions, involving end-users in visualization design and verification of all metrics. The concept of “dynamic monitoring” was developed by identifying the most appropriate data science predictive model approach. It involved reviewing a wide array of metrics and selecting those most relevant as features in predictive models. To ensure a successful roll out of the platform (named “ATLAS”, an implementation of Tata Consultancy Services [TCS] ADD Analytics & Insights Platform), Janssen also developed a full change management approach to further socialize changes needed in monitoring processes.
The platform allows for dynamically monitoring the totality of the workload, in addition to Source Data Verification/Source Data Review, at an investigative site. This approach leverages the available data irrespective of source, to enable faster identification, assessment, and mitigation of issues and risks via informed and timely actions. The platform utilizes predictive modeling to proactively inform the site monitors well in advance (at least 30 days) when there will be enough work to schedule a site visit. This workload estimator is based on the data presented in several operational dimensions across multiple categories.
This paper describes in detail the technical and process activities related to the successful roll out this platform within Janssen R&D.
Technology considerations
Various data and analytics disciplines and services were utilized to develop the platform. Master data management and data governance form a foundational layer defining the platform requirements. Through data engineering and integration, data from various sources are transformed and ingested to regularly refresh the information in the platform. Through data modeling, a blueprint for the design of the database was developed. Data is ingested into a data lake for further transformation, and then loaded into a data warehouse as modeled.
The platform integrates data from more than ten operational and transactional sources into a sustainable architecture that allows more than just standard dashboarding. This solution allows for central and local teams to review data such as contracting, or KRI such as open issues.
A cross-functional development team comprised of both technical and business subject matter experts identified approximately 3,000 unique data points supporting 213 metric definitions and 936 visualizations for five distinct user roles. The metrics were further categorized into five distinct categories. The visualizations were developed, designed, and approved by end-users working directly with business analysts and system developers. The following sections describe the technical aspects of Master Data Management (MDM), Data Integration (DI), Data Modeling, Dynamic Site Monitoring Algorithm Development, and User Interface (UI) Development.
Master data management and governance
To document the requirements for the development of the platform, the team established Integrated Analytics Definitions (IAxD) as a data governance framework. Aside from the benefits of having clear units to describe the development, IAxD support clear lineage of the information, indicating the source systems/attributes that contribute to each generated insight. Integrated Analytics Visualization Definitions (IAVDs/# 936) define the different components that contribute to any visualization (type of visualization, attributes used, metrics calculated, functionality desired). Integrated Analytics Metric Definitions (IAMDs/# 213) document the required calculations and measurements through detailed business logic, the required data elements identified through Integrated Analytics Data Definitions (IADDs/# 3053), the Red-Amber-Green thresholds, and other key attributes that add more context for the IAMD. Finally, the IADDs identify and describe the source data elements from the supporting data model required to produce the IAMD and IAVD.
Data integration
Data from clinical and operations systems were required as bases for analytics calculations and visualizations. To make this data available, 13 pipelines were built to ingest data. The data was transferred from Janssen’s internal and cloud solutions to a data lake by a configurable ingestion mechanism. From the lake, the data was transformed and loaded into the data warehouse data model. (Figure 1)
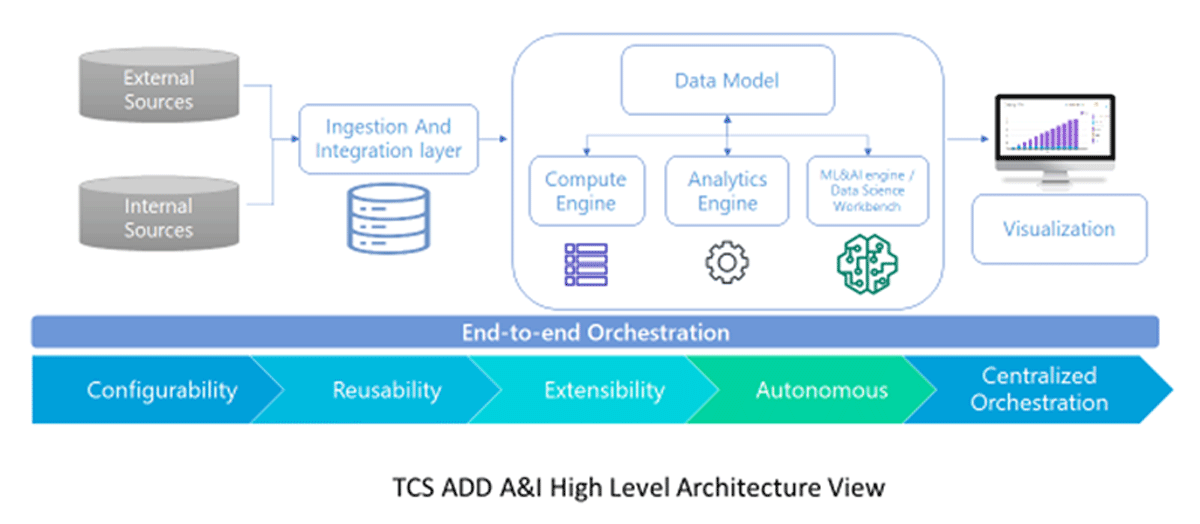
The platform architecture.
For example, the operational model for Electronic Data Capture (EDC) data, which provides a basis for many KRI/KPI, is populated through ingestion and transformation of clinical transaction records from electronic case report forms into a common model. This transformation is based on descriptive metadata used to map disparate trial-specific structures to common EDC operational components including subjects, visits, pages, and queries with associated statuses and milestone dates.
The data warehouse contains 170 tables across eight domains in a relational data model that is aligned with the Janssen conceptual data model (including transaction level history).
On that basis, data marts are calculated and aggregated to feed visualizations with specific data content and metrics. This layer is optimized for end-user performance experience.
The entirety of the data processing is orchestrated by a scheduling and monitoring framework with full automation and alerting. Jobs are executed in parallel and sequential groups based on data dependencies and for optimal end to end performance. Multi parallel processing has minimized refresh cycle times, as have database partitioning, indexing, and query optimization based on execution plans.
The end-to-end orchestration uses a configurable, low-code mechanism, which allows quick configuration and building of the ingestion and processing pipeline with in-built data verification checks. (see Figure 1)
Data modeling
The core of the implementation, the clinical data model, is based on Biomedical Research Integrated Domain Group (BRIDG)10 to maximize interoperability. The model uses shredded Entity Attribute Value (EAV) model data structures, which can be implemented in multiple databases such as Relational, Graph, Document (NoSQL). The model is generic, encompassing multiple domains, but also provides flexibility for customization.
Dynamic site monitoring models
Linear and non-linear methods were explored to identify an optimal model that captures complex relationships in the data. Many machine learning models, including traditional methods such as Gradient Boosting Machines (GBM), Random Forest, and Penalized Linear Regression, have been explored and assessed. Deep learning methodologies, including variants of sequential methods, were explored, and evaluated on longitudinal clinical and operational data to identify the optimal methodology for predictive analytics based on the data of interest. Twelve-month predictions that utilize longitudinal data were performed using sequential methods. Sequential neural network models such as Recurrent Neural Networks (RNN), Long Short-Term Memory (LSTM), and Gated Recurrent Unit (GRU) were fitted to the data to identify the superior model based on the performance metrics for longitudinal data. The rationale for selecting the sequential models was to be able to capture temporal relationships in the data on the rich longitudinal datasets. Data that was collected and captured across several visits and months and across several metrics have temporal relationships. From the sequential method variant’s LSTM had superior performance compared to simple RNN and GRU method.11,12
User Interface (UI) development
User interface (UI) development started with Design Thinking13 sessions with end-users to ensure fit for purpose visualizations (type of graph and components, line listing) and functionality (filters, click-through of graphs, switches, reset buttons) feedback were incorporated in the final design.
Based on the user feedback, two sets of visualizations for predictive site risk profile and workload were developed. Risk was defined as composite score of several parameters including operations issues, such as “Open Issue” as well as data management issues such as “Missing Pages”, amongst other parameters. Workload was calculated based on feedback from site-facing monitoring personnel at Janssen and included workload drivers such as “Drug Accountability”, Trial Master File Review, and SDV/SDR.
In addition to a standard KPI dashboard, visualization based on forward-looking predications were designed and are included in the dashboard. These predictive models include Predicted Site Management Workload Over Time (see Figure 2), Predicted Site Composite Site Profile Over Time focusing on changes in a particular site risk (see Figure 3), and a combination of Site Profile vs. Workload for identifying high risk sites with high workload (Figure 4).
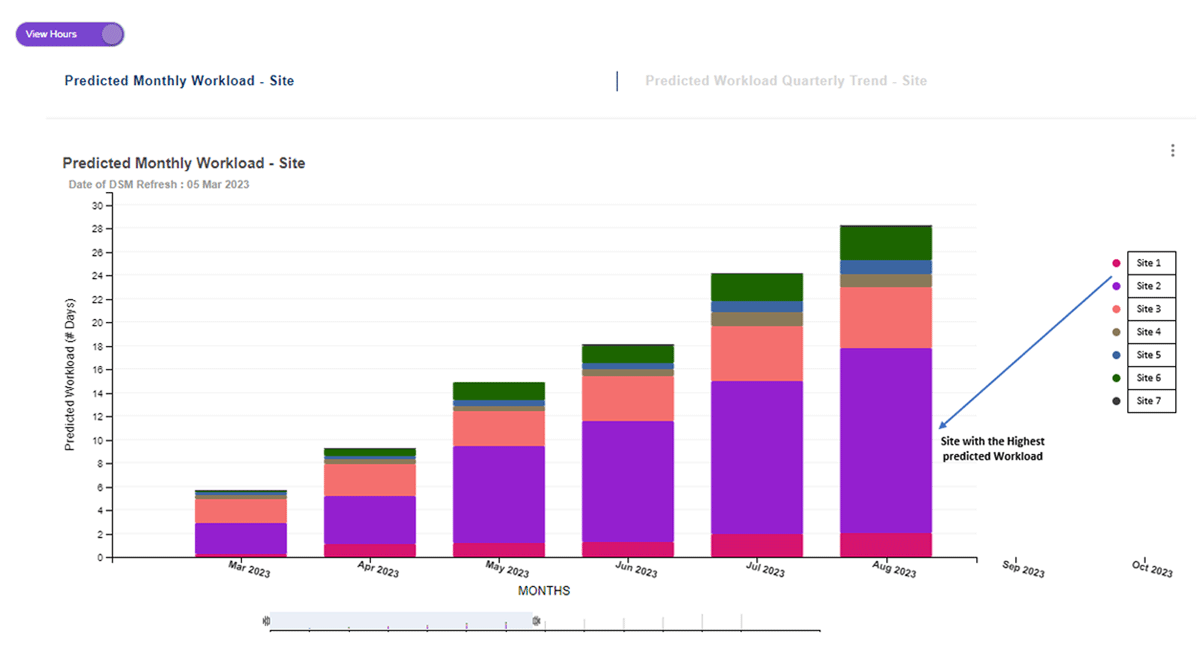
Dashboard for end users to plan their activities using the predicted workload.
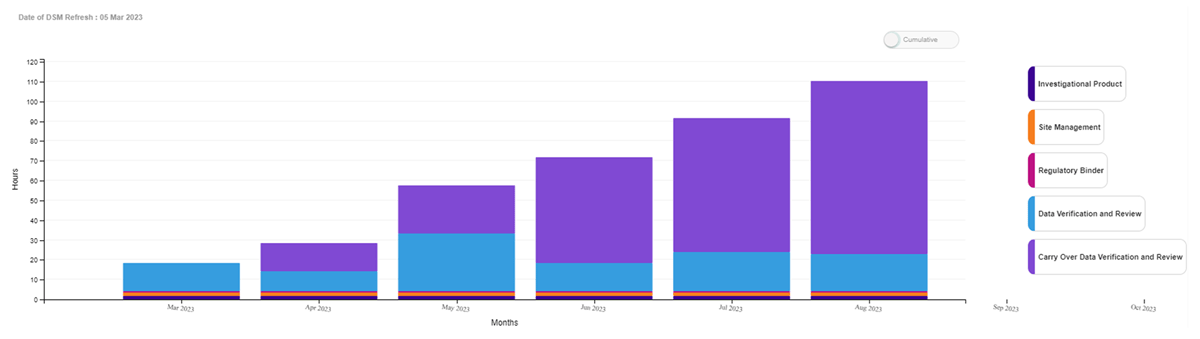
Predicted Site Workload Drivers Over Time at the Site of Interest.
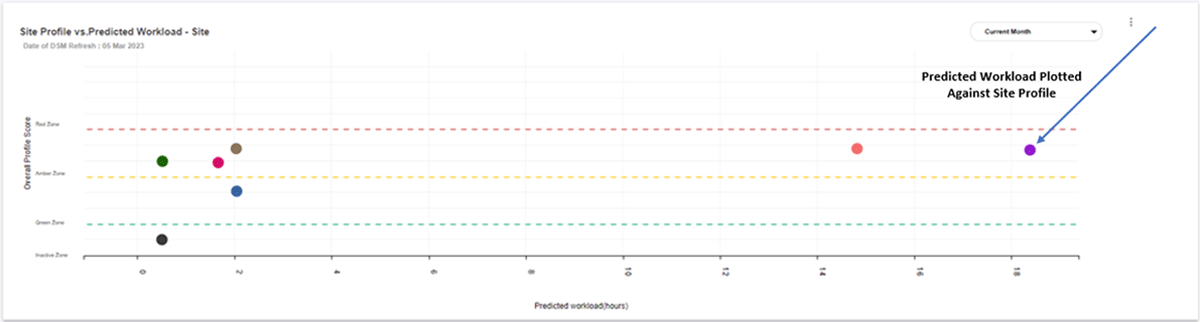
Site Profile plotted versus Predicted Workload.
The requirements, visualizations, and metrics were organized in the following functional domains or ‘categories’: Study Management, Site Management, Subject Management, Data Management, and Budget Management.
The requirements were captured in mock-ups as a basis for the documentation. Utilizing the mock-ups, the various visualizations and functionalities were transcribed in IAVD, allowing for linking with IADD and IAMD and facilitating review, approval, and preparation of wireframes. Wireframes mimicked the end-result regarding the functionality and helped to finalize the requirements for UI development.
The user experience is further enhanced with the addition of a functionality called Communication Module, which enables the generation of easy to interpret list of alerts and to-do’s that require a specific action or follow up by site-facing roles (e.g., upcoming milestones, missing pages, open queries, action items, etc.)
Platform implementation
Business model changes
To fully leverage the use of the Integrated Analytics Platform by clinical management, processes around scheduling and activities conducted prior to and during each trial site visit needed to be reevaluated. While Janssen’s advanced methods in implementing Risk Based Monitoring have already contributed significantly to data quality improvement, the predictive modeling of the platform allows monitoring organizations to move away from fixed monitoring frequency to a “need-based” approach.
To implement the changes, two key initiatives were rolled out. Firstly, Monitoring Guidelines were adjusted to remove the fixed monitoring frequency, allowing the platform’s predictive analytics to determine optimum site visit scheduling. Secondly, to ensure platform use, a robust change management program was put in place.
For a successful implementation, the team considered how and when to dynamically engage with clinical trial sites for monitoring activities, supported by predictive and adaptive algorithms to better focus their efforts on key risks/issues. This is a departure from standard fixed frequency contact with investigator sites.
In preparation for a visit, the site monitors and the Clinical Research Associate (CRA) leverage the data in the same platform to access information from all relevant transactional systems. The reports can be downloaded and shared proactively with the Investigator sites.
Change Management
A McKinsey global survey on digital transformation found that less than one third of technical initiatives achieve their stated goals.14 To ensure successful implementation of a new technical tool with a significant impact on business processes, Janssen opted to use the Prosci Change Management Model15 to develop and execute a change management strategy early in the technical development process. The Prosci model was used to address awareness, desire, knowledge, ability, and reinforcement (ADKAR®). Janssen then followed the three-phase change management process, which focused on preparing for the change, defining the change management strategy, and setting up a Change Management and Communication Workstream (CMCW). Prior to the platform release, the staff had to manually collate data from different dashboards, which was highly inefficient and time-consuming. This prompted Janssen to adopt a dynamic monitoring approach to better focus on key risks/issues.
Phase 1 focused on preparing for change and defining the change management strategy. A CMCW was set up and connected to the project team, sponsor committee and the steering committee. The workstream performed readiness assessments and subsequently customized a management strategy focusing In-depth stakeholder analysis, identifying Change Agent Network, developing a communication, resistance management, and training plans.
Phase 2 of the project focused on developing and implementing Change Management Plans through a series of global awareness sessions for the main target audiences.
Specific sessions were built for the leadership teams of the impacted departments, with special focus on their full engagement and commitment; people managers of the impacted roles, with a special focus on their support of change for their direct reports; and other impacted roles, with a special focus on how the change will benefit them.
Phase 3 of the Implementation phase focused on reinforcing change (measuring performance, celebrating success, and identifying and addressing root causes of resistance) as well as measuring the adoption of both platform and process, especially by the Site Management role.
Results
The platform was fully rolled out in March 2021. Since then, the development team has focused on the adoption curve. Immediately after release, the implementation team developed a series of metrics to measure the access per-role, concentrating on adoption, especially by Investigator Facing team members. The results show an immediate uptake in the dashboard usage, with majority of the roles accessing the tool repeatedly. In 2022, an average 3600 unique users accessed the platform each quarter, with an average of each user accessing the platform eighteen times, and the Dynamic Site Management Module five times respectively (See Table 1, and Figure 5).
Access by End User by Quarter.
| Quarter | Landing Page | Dynamic Site Management | Distinct user logins |
| 2021 Q1 | 3723 | 815 | 895 |
| 2021 Q2 | 34488 | 9494 | 2571 |
| 2021 Q3 | 42839 | 9499 | 2714 |
| 2021 Q4 | 42397 | 9370 | 2740 |
| 2022 Q1 | 60570 | 17304 | 3423 |
| 2022 Q2 | 58810 | 16868 | 3431 |
| 2022 Q3 | 67932 | 20076 | 3771 |
| 2022 Q4 | 67648 | 16913 | 3773 |
| 2023 Q1 | 60994 | 14531 | 3406 |
| 2023 Q2 | 54929 | 13132 | 3232 |
| Average in 2022 | 18 | 5 | 3600 |
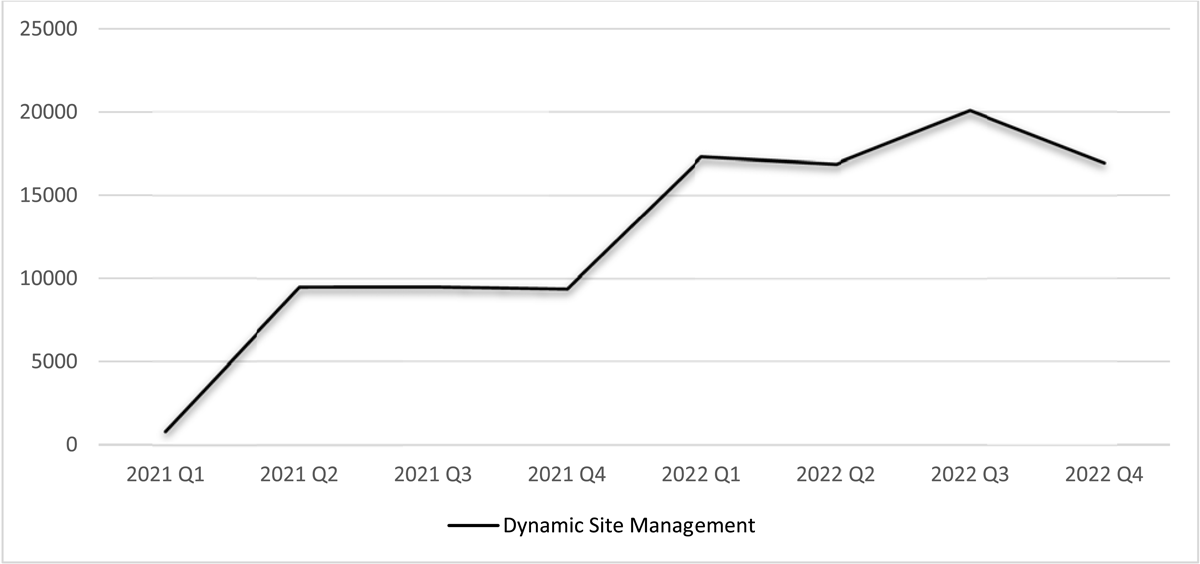
Dynamic Site Management Access Showing Constant Increase Since Launch in 2021.
The platform supports 270+ clinical trials across seven therapeutic areas. The platform has supported risk-based monitoring of more than 20 COVID-19 related trials. The application continues to be upgraded with new features and has enabled other systems in the clinical trial ecosystem with data feeds and reports.
A survey of the platform was performed six months after its roll-out. The results are noted below. 44% of Site Managers noted a gain in efficiency preparing for a visit, with another 37% showing a “Neutral” sentiment (Table 2).
Respondent Sentiment on Efficiency Gained by Use of the Platform.
| Efficiency Gained by Use of ATLAS | Number of Respondent | Percent of the Respondent |
| Strongly agree | 49 | 10% |
| Agree | 160 | 34% |
| Neutral | 175 | 37% |
| Disagree | 66 | 14% |
| Strongly disagree | 26 | 5% |
| Grand Total | 476 | 100% |
59% of respondents liked the focused role-based easy access to relevant data leading to effective and timely actions (Table 3). 66% of users would recommend the platform to their peers.
Majority of Respondents Found the Platform Relevant to Their function.
| Relevant to My Role | Number of Respondent | Percent of the Respondent |
| Strongly agree | 78 | 13% |
| Agree | 278 | 46% |
| Neutral | 181 | 30% |
| Disagree | 53 | 9% |
| Strongly disagree | 16 | 3% |
| Grand Total | 606 | 100% |
In addition to changes in processes such as updating monitoring guidelines, the Clinical Operation Organization has realized 3% savings in monitoring cost. This efficiency is in addition to the savings already gained by the full implementation of Risk Based Monitoring for all R&D studies at Janssen since 2015.
The Communication Module also represents a unique feature and substantial enhancement to Dynamic Site Monitoring, enabling efficient planning and execution of interactions with sites and investigators. The module allows different roles to follow up on identified issues within and outside the platform.
Conclusion
This paper emphasizes the importance of an advanced analytical platform in managing quality and workload for a Site Manager/CRA during clinical trials. This workload is a major contributor to the cost of drug development, yet practices have been slow to change. In 2012, Kramer et al.16 noted the burden of clinical trials and the need to change the regulatory environment globally. Since then, new regulations and the COVID-19 pandemic have pushed the industry to move away from fixed monitoring frequencies and to embrace dynamic monitoring solutions. Utilizing the data available in clinical research, it is possible to consider how technology can support a new business model by improving efficiency for clinical trial staff.
To ensure the successful rollout of a platform, it is important to form a team of experts that has a clear understanding of the three components of the project: the business model, predictive models, and change management. By combining these three elements, it is possible to develop a successful platform.
The role of advanced analytics in various aspects of operations is becoming a cornerstone of pharmaceutical industry as a whole. When implementing large-scale projects, it is necessary to have a thorough understanding of the business need and the corresponding Machine Learning methodologies that should be employed to address it. Without this clear understanding of the problem that needs to be solved, the analytics team will not be able to provide a useful solution to their clients. In conclusion, over the last decade, regulatory and industry standards for clinical trial conduct have shifted to a risk-based approach with an increased focus on efficiency, leading to both lower cost and higher quality outcomes. This shift has enabled pharmaceutical companies to leverage technology, data, and analytics, to lay the groundwork for the development and implementation of a comprehensive dynamic monitoring solution. With the successful roll out of the ATLAS platform, Janssen has demonstrated how to use predictive and prescriptive analytics to proactively inform the site monitors well in advance when there will be enough work to schedule a site visit and thereby optimize the use of resources. In addition, the platform can be used to proactively predict issues of concern before becoming a regulatory concern. Overall, the successful implementation of Janssen’s platform has provided a framework for other pharmaceutical companies to evaluate and adjust their approaches for engaging with clinical investigator sites and managing the pressures on clinical operations.
Competing Interests
The authors have no competing interests to declare.
References
1. US Food and Drug Administration. Pharmaceutical quality for the 21st century a risk-based approach progress report. Published May, 2007. Accessed October 4, 2023. https://www.fda.gov/about-fda/center-drug-evaluation-and-research-cder/pharmaceutical-quality-21st-century-risk-based-approach-progress-report.
2. Clinical Trials Transformation Initiative. Quality by design. Accessed October 4, 2023. https://ctti-clinicaltrials.org/our-work/quality/quality-by-design/.
3. US Food and Drug Administration. FDA oversight of clinical investigations — a risk-based approach to monitoring. Published August, 2013. Accessed October 4, 2023. https://www.fda.gov/media/116754/download.
4. European Medicines Agency. Reflection paper on risk-based quality management in clinical trials. Published November 18, 2013. Accessed October 4, 2023. https://www.ema.europa.eu/en/documents/scientific-guideline/reflection-paper-risk-based-quality-management-clinical-trials_en.pdf.
5. TransCelerate Biopharma Inc. Position paper: risk-based monitoring methodology. Accessed October 4, 2023. http://www.transceleratebiopharmainc.com/assets/risk-based-monitoring/.
6. International Council for Harmonisation of Technical requirements for pharmaceuticals for human use. Guideline for good clinical practice E6(R2). Published November 9, 2016. Accessed October 4, 2023. https://database.ich.org/sites/default/files/E6_R2_Addendum.pdf.
7. Kwan A, Schoroek M, Kawamura J. Architecting an Operating Model, A Platform for Accelerating Digital Transformation. Deloitte Insights, 2019. Accessed October 23, 2023. https://www2.deloitte.com/content/dam/insights/us/articles/5078_architecting-an-operating-model/DI_architecting-an-operating-model.pdf.
8. Osterwalder A, Pigneur Y. Business model generation: a handbook for visionaries, game changers, and challengers. John Wiley & Sons; 2010.
9. Djali S, Van Yper S, Janssens S, Van Parijs J. Use of information and technology in managing quality and risk in clinical trials. Ther Innov Regul Sci. July, 2010. 44(4): 359–373. DOI: http://doi.org/10.1177/009286151004400402
10. National Institutes of Health. Biomedical Research Integrated Domain Group, data model standard developed by CDISC. Accessed October 4, 2023. https://bridgmodel.nci.nih.gov/.
11. Hochreiter S, Schmidhuber J. Long short-term memory. Neural Computation. 1997; 9(8): 1735–1780. DOI: http://doi.org/10.1162/neco.1997.9.8.1735
12. Mirza B, Li X, Lauwers K, et al. A clinical site workload prediction model with machine learning lifecycle. Healthcare Analytics. 2023; 3. DOI: http://doi.org/10.1016/j.health.2023.100159
13. Brown T. Design thinking. Harvard Business Review. 2008; 86(6): 84–92, 141.
14. McKinsey & Company. Unlocking success in digital transformations. Published October, 2018. Accessed October 17, 2023. https://www.mckinsey.com/capabilities/people-and-organizational-performance/our-insights/unlocking-success-in-digital-transformations.
15. Prosci. The Prosci ADKAR model. Accessed October 4, 2023. https://www.prosci.com/methodology/adkar.
16. Kramer JM, Smith PB, Califf RM. Impediments to clinical research in the United States. Clin Pharmacol Ther. 2012 Mar; 91(3): 535–41. DOI: http://doi.org/10.1038/clpt.2011.34