

Introduction
Clinical trials conducted in community oncology settings have expanded the range of treatment options available to patients and facilitated advancements in drug development. Within these settings, the electronic medical record (EMR) serves as the primary source for identifying eligible patients for potential inclusion in clinical trials.1 The EMR comprehensively tracks patients’ multidisciplinary care, encompassing cancer and comorbidity information, therapy and treatment strategies, medications, and general health or performance status data in a standardized and structured manner.2 Key clinical characteristics, such as cancer stage,3 which identifies the disease’s advancement, and performance status, which indicates overall health and functioning level,4,5 are crucial in delineating both inclusion and exclusion criteria for patient enrollment in clinical trials.6,7,8 However, cancer stage and performance status are not always present in the structured fields of the EMR, hindering efforts to identify patients that meet the eligibility requirements defined in the inclusion criteria.9 Most clinical notes, including those from oncologists, mid-level professionals and nurses, present unique machine curation challenges due to stylistic variations as they comprise narrative text notes, typed or dictated, that form semi-structured and unstructured content.10,11 The variability in expression, form, and content within these notes underscores the need for advanced data processing methods. Additional clinical data related to genomics and molecular diagnostics further complicate patient qualification for clinical trials.12
To extract relevant fields, various NLP and artificial intelligence (AI) models have been utilized in other studies. Some studies focused specifically on performance status13 or cancer staging,14 specific cancer types,15,16 or used a small population.17,18 Traditional NLP-based approaches can yield high accuracy results. For example, Cohen et al.13 focused on performance status, which yielded an additional 12.8% completed records with 93% accuracy. Their methodology focused on using a certain type of algorithm based on NLP for one specific structured field: performance status. Similarly, Abelian et al.19 used NLP to identify cancer staging values with accuracy up to 93%. To our knowledge, there has been no other research that focuses specifically on extracting stage groups. This is a limitation in cases in which a clinical note may only report the stage group and not the tumor, node, metastasis (TNM) value, meaning that TNM based algorithms would falsely report that no staging was detected. While differences in data sources and methodologies contribute to variations when comparing results, the results of these studies can nonetheless be used as a baseline to compare against the results of this project. Another prominent NLP technique in recent research is the use of LLMs.20 However, LLMs can be prone to “hallucinations”.21,22 In this context, hallucinations are incorrect predictions caused by insufficient contextual understanding. The probabilistic and often black-box nature of LLMs introduces additional difficulty in the interpretation of model results, complicating efforts to identify and resolve model errors. These can hamper efforts to apply LLMs in the medical workflow, where financial constraints and accuracy are paramount.
To address these limitations, this quality improvement project focused on completing the records for key clinical elements to streamline the chart review process by providing a more comprehensive view of patient eligibility. Specifically, the project focused on extracting performance status and both TNM and stage grouping from unstructured clinical notes. By extracting both TNM and stage group values, the likelihood of capturing relevant staging information is increased. Moreover, this work explores multiple algorithms, using a hybrid approach that combines regular expressions (regex) and semi-supervised learning to create a more accurate and more comprehensive workflow that can serve as the building block for future models by providing structured, labeled datasets from unstructured data. This quality improvement paper investigates the application of NLP and semi-supervised learning to extract and classify patient staging and performance status from historical clinical EMR data and relevant diagnostic information, aiming to identify and monitor eligible patients for clinical trial enrollment, particularly in solid tumor cancer cases.
Ethics review
The project was designed as a single-site technology assessment initiative to retrospectively identify solid tumor cancer staging values and performance status from clinical notes, enhancing patient records’ completeness, accuracy, and utility. These staging and performance status values were essential for the identification of patient cohorts during the chart review process within the practice.
For model training, clinical and consult notes were uploaded to a secure, HIPAA-compliant cloud server with access restricted through multi-factor authentication. Personal Health Information (PHI) components of each medical record were de-identified. This was done by running a redaction script to de-identify the PHI components of each medical note. After completing algorithm development, all clinical data and model artifacts were deleted from the server. The authors did not seek an Institutional Review Board (IRB) review because the project was determined to be a single-site quality improvement initiative; the project did not deprive patients of clinical services or involve human subjects.
Methods
This project focused on clinical notes from Utah Cancer Specialists (UCS), specifically consult and progress notes that contained performance status and staging values for diseases. These records, encompassing 66,785 patients between 2003 and 2022, totaled approximately 100 GB of Rich Text Format (RTF)-encoded data and were stored in JavaScript Object Notation format. The overall workflow of the methods can be seen in Figure 1.

Figure 1: Workflow Diagram.
The unstructured clinical notes were loaded into a Python Pandas dataframe. Each row corresponded to a unique patient visit note. Preprocessing was performed on all medical notes to remove stop words, and trailing, leading, and duplicate spacing. Additionally, a regex pattern was applied to remove the RTF encoding. Medical notes with fewer than 50 characters were removed as they often referenced image files or were blank and unlikely to contain any important clinical elements. These transformations reduced the size of the dataset by 75%. Elimination of noise in the data facilitated an efficient model training process by significantly reducing dimensionality and enhancing the feature relevance. Further preprocessing specific to each workflow (stage group, TNM, and performance status) was performed and is outlined below. Python methods used for preprocessing can be seen in Table 1.
Table 1: Python Packages.
| Package | Purpose |
| Pandas | Loading data as dataframes |
| WordNet | Filtering English words |
| Spacy | Tokenizing text |
Stage group
For staging, a regex pattern was employed to identify the “impression” subsection of the clinical note. This subsection is the summary of the medical specialist’s examination of the patient and was the most likely field to contain the staging value, based on preliminary findings. This identification of the “impression” section of the clinical note also reduced false positives as staging values of family members may be included in the family history subsection. The International Federation of Gynecology and Obstetrics (FIGO) also uses the FIGO staging system for endometrial cancer.23 Any instances of “figo” were therefore replaced with the string “stage”, as these can also be used in place of “stage” for values and would reduce the logical complexity for the algorithms. The primary logic of the regex patterns to extract stage group values involved the matching of substrings in which the first element is “stage” followed by a number. This number can be one of the following values: x (indicative of placeholder or undetermined stage), 0, 1, 2, 3, 4, i, ii, iii, or iv.24 The model output would be strings that satisfy the pattern alongside any letters directly attached to the number as model output. This allowed for the detection of staging variations such as “stage ia”. The rest of the text from the sentence would be used for review purposes and to reduce false positives.
Once model outputs became available, the next step was to reduce false positive staging values (values that were detected by the regex pattern but were not describing a relevant cancer staging value) through a series of steps, described below:
Remove any extracted stage value longer than 13 characters because the combination of the numbers, letters, and spaces was determined to be 13 characters max. For example, “stage iiiapcr” has 13 characters. Analysis showed that any values with more than 13 characters were usually false positives from noise in the data such as “stage if determined”. Such an instance would be detected by the model and may arise from typos or errors in optical character recognition (OCR) where spaces may be concatenated.
Drop instances in which the stage output included non-alphanumeric characters. For example, “stage 1–3”, as these were often a range of stage values that suggest ambiguity in stage value.
Remove any staging values that contain an English word from the Python NLTK English WordNet dictionary as this indicates that the adjacent letters to the Roman numeral are not a staging value. An example extracted stage output would be “stage in” where the “i” in the word “in” can be considered a Roman numeral and would be picked up by the initial stages of the algorithm.
Eliminate outputs that were a range of values such as “stage 2 or 3” rather than a discrete stage value for reasoning similar to step 2.
Drop instances in which the sentence contained a noncancerous disease. An example would be “stage 3 chronic kidney disease”, which is describing a stage value for a noncancerous disease.
TNM
The TNM algorithm’s preprocessing, regex detection, and layers of false positive filtering logic were similar to the stage group workflow. The impression subsection of the note was used for the same reasons as the stage group algorithm. TNM preprocessing involved the deletion of any words in the medical notes that were contained in WordNet. This significantly reduced the volume of data the algorithm needed to parse as these English words are not needed for the TNM algorithm. Additionally, all remaining punctuation and words containing an apostrophe were removed.
After application of the TNM preprocessing, regex patterns were employed to extract the TNM values. TNM patterns were divided into two cases. The first is TNM with no spacing between the TNM values such as “t3n1 m1”. The second was TNM values with spaces in between such as “t3 n1 m1”. The rules used for the regex pattern based on AJCC guidelines are as follows:
“T” can only be preceded by “p”, “c”, “y”, or “r” and the numerical value immediately afterwards can only be x, 1, 2, 3, 4 in Arabic or Roman numerals.
The “N” component must be succeeded by x, 0, 1, 2, or 3 in Arabic or Roman numerals.
The “M” component must be succeeded by x, 0, or 1 in Arabic or Roman numerals.
For simplicity, the regex pattern required the “T” value to be the first value in the series and that the accompanying “N” or “M” values are at most 10 characters away in the preprocessed text.
The following false positive elimination process was conducted:
Any values that had the “N” and “M” components but not the “T” components were omitted.
If the value consisted of only the “T” component, it was omitted.
Performance status
The workflow for performance status, a measure of the physical health of the patient, uses two scales: Karnofsky and Eastern Cooperative Oncology Group (ECOG).4,18 However, initial exploratory data analysis revealed that of the records that did have performance status, only 4% used ECOG while the other 96% used Karnofsky. Hence, model development focused on Karnofsky though a similar implementation can be used on ECOG. The Karnofsky values are 0, 10, 20, 30, 40, 50, 60, 70, 80, 90, 100 with 100 indicating healthy condition and lower values indicating an unhealthy condition.
Performance status preprocessing involved replacing the strings “performance score” and “performance status” with “ps” for consistency and to reduce the number of unique cases to detect. A regex pattern was developed to detect any instances of strings that satisfied the pattern “karnofsky” or “ps” followed by any of the Karnofsky values. The regex also extracted fifty words to the left and right of the numerical value to help to determine context for model training and for false positive reduction. The following false positive elimination process was conducted:
Karnofsky value of 0 was omitted as this indicates the patient was deceased.
Any performance status values within a 4-word proximity to a month such as “January” or a Roman numeral value were dropped as the numerical value may be falsely identified as the performance value.
Further refinement of the performance status detection incorporated semi-supervised NLP by training a classification model using L1 (Manhattan distance) to measure the distance between vectors of the verified regex outputs using the scikit-learn python library. The scikit-learn methods used can be seen in Table 2. This approach uses both labeled and unlabeled data to train a classification model. L1 distance measures the absolute difference in magnitude between two vectors as seen in Equation 1. Development focused on the Karnofsky values because preliminary analysis revealed a higher prevalence of Karnofsky in the dataset compared with staging. The data that contained Karnofsky values was partitioned into an 80% training and 20% testing split, ensuring patient exclusivity across each set to prevent data leakage. TF-IDF, an encoding algorithm, was employed to encode the partitioned data as separate bigram-based matrices for each label. Each matrix row vector represented the surrounding text of the patient’s Karnofsky value. This reduced noise and distinguished significant contextual patterns within the text.
(1)
Where:
x, y are two encoded vectors
n is the number of unique encoded bigrams
d(x, y) is the L1 distance between the vectors x, y
Table 2: Scikit-learn Methods.
| Method | Purpose |
| TfidfVectorizer() | Encode dataframes as bigram TF-IDF matrices |
| pair_wise_distances() | Compute L1 distance |
Model validity and performance was manually reviewed with iterative tuning. The model outputs were reviewed by the data scientists. If the outputs passed the algorithm-specific unit tests, they were sent to the team of clinical informaticists. Example unit tests for Karnofsky are seen in Table 3.
Table 3: Karnofsky Unit Test Examples.
| Input | Expected Karnofsky Output |
| Patient PS: 40. | 40 |
| Physical examination suggest performance status 80. | 80 |
| Performance status normal. | 100 |
| Patient in moribund status, disease rapidly progressing, requires urgent care. | 10 |
Based on feedback, the model logic was adjusted. Parameters were fine-tuned on the train set to maximize model accuracy. Hypertuning focused on the min_df parameter, which excluded bigrams that appeared in fewer than the min_df specified percentage of the clinical notes. This helped to remove low-frequency terms that were unlikely to influence Karnofsky scores. Model min_df values are seen in Table 4. The model was tested on the test set to ensure the model was not overfitting.
Table 4: Karnofsky Score L1 Hyperparameters.
| Karnofsky Values | min_df |
| 10,20,30 | 0.0 |
| 40,50,60 | 0.5 |
| 70 | 0.6 |
| 80,90,100 | 0.5 |
Results
The methods employed by this intervention yielded an efficient way to optimize clinical trial enrollment by identifying patient stage group value, TNM and performance status, as can be seen in Table 5. Accuracy was computed by comparing the number of correct model predictions divided by the total number of model predictions. The accuracy of the models ranged from 96% to 98%. The accuracy metrics were derived from uniform random sampling of model outputs, ensuring a confidence level within a 5% margin of error. The percentage of patients with a structured field populated from the models for stage group, TNM, and Karnofsky workflows were 29.62% (19,873 patients), 21.01% (12,069 patients), and 40.64% (27,141 patients) respectively. It is important to note that the models were run on all patients with a disregard as to whether those patients had solid tumor cancer. Hence, the record completeness percentage may be higher when filtering to only cancer patients.
Table 5: Completion and Accuracy Results for all Workflows.
| Workflow | Patients with Structured Value | Accuracy Percentage |
| Stage Group | 29.62% | 98 |
| TNM | 21.01 | 96 |
| Karnofsky | 40.64 | 98 |
The results of the layer logic that eliminated false positive cancer stages for stage group can be seen in Table 6. The first layer that performed the regex pattern match had the greatest drop in patient stages at 68.78%. The performance status distribution for Karnofsky can be seen in Figure 2. Karnofsky status 10–50 were grouped because of the small distribution that they encompassed.
Table 6: Layers for Stage Group Workflow.
| Layer for Numerical Staging Model | Number of Patient Stages Dropped | Number of Patient Stages Remaining | Percent of Patient Stages Remaining |
| Initial Population | 0 | 66,785 | 100 |
| 1. Regex Pattern Match | 45,937 | 20,848 | 31.22 |
| 2. 13+ Characters | 15 | 20,833 | 31.19 |
| 3. Non-alphanumeric Characters | 60 | 20,773 | 31.10 |
| 4. English Dictionary | 4 | 20,769 | 31.10 |
| 5. Conflicting Values | 149 | 20,620 | 30.88 |
| 6. Non-cancerous Disease | 747 | 19,873 | 29.76 |
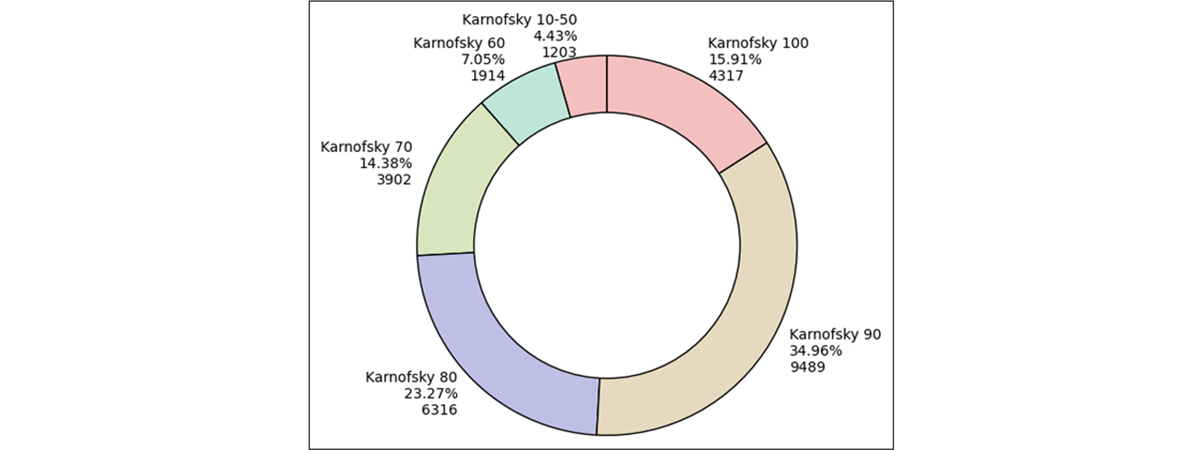
Figure 2: Karnofsky Performance Status Distribution.
The semi-supervised L1 Karnofsky model yielded a MAE of 1.57. This indicated that the average differences between the model predictions and the true Karnofsky values was minimal, indicating a high model accuracy. The semi-supervised L1 Karnofsky model is also able to accurately detect the performance status value without explicit mention of the numerical value, allowing for greater flexibility and variation in the text. For example, “Patient exhibits normal condition” would suggest a Karnofsky score of 100 but may be missed by the initial regex algorithms.
Discussion
For the staging workflows, there was a lower completion rate compared with performance status. This difference can be attributed to the broader applicability of performance status across all patients, unlike solid tumor staging, which is only relevant to a subset of the population because not all patients had a solid tumor cancer. Considering that there is a relationship between stage group and TNM staging (because stage group can be derived from TNM staging), it is possible to still determine stage group value if the TNM staging value has been extracted. This is an area in which improvements can be made so that certain guidelines can be implemented to map the TNM staging values to stage group to increase the number of structured stages.
A notable characteristic of the semi-supervised NLP model was that the majority of mismatched predictions had a delta of 10 when compared to the true value. For example, the model would predict a Karnofsky value of 80 but the true value was 70. The reason is that numerically closer Karnofsky values, such as 70 and 80, tend to share more words in common than values that are further apart, such as 10 and 80. This pattern can be attributed to the similarity in linguistic content of the adjacent Karnofsky values. Scores that are closer together in numerical value often have more common terms compared to values that are further apart. This can be further supported by clinical examples where the medical specialist gave a numerical range of Karnofsky values, such as “70–80”, rather than a single Karnofsky value.
Overall, the algorithms all had high accuracy that performed above the expected baseline. This was possible due to the strict focus on false positive elimination. This was important because the models served as a means for gathering labels to be used for creating a semi-supervised model, as was done for the performance status model. The L1 classification model yielded the highest accuracy in determining performance status compared with models such as cosine similarity. L1 places higher weights on the length of the vectors in determining their difference as opposed to cosine similarity which compares the angle. This was effective because of the high dimensional feature space and distribution of vector lengths. Analysis revealed that vectors with lower Karnofsky statuses had higher word counts due to the complexity of describing the patient’s medical condition such as “Patient has severe bleeding, requires critical medical care around the clock”. This is in stark contrast to the typically more succinct descriptions for higher Karnofsky status patients, sometimes merely stating “Patient status normal”. As such, the emphasis on detecting the differences in not only the content but the difference in magnitude in the length of the text meant that L1 proved superior.
The findings from the workflows and the semi-supervised learning algorithm lay a foundation for future development. The structured data output can be used to train future models, with the extracted text used as features and the algorithm predictions used as labels that can then be passed to pretrained LLMs for fine tuning. This would help reduce model hallucination errors by incorporating medical context.25
Conclusion
With the rule-based regex algorithms and semi-supervised NLP workflows, structured values can be extracted to populate patient records. This approach can be particularly powerful in situations in which there is a high ratio of unlabeled data to labeled data. Populated patient records can help to streamline the clinical trial enrollment process by reducing the time spent on manual chart review. This process is not aimed to replace medical specialists in the workflow, but to help augment patient cohort identification with semi-automation. Future work can focus on implementing a similar methodology to extract structured values for molecular biomarkers, staging for non-solid cancers, clinical symptoms, and other key clinical elements. These structured values can be used to build additional classification models and fine-tune LLMs, enhancing accuracy and performance in clinical applications.
Competing Interests
The authors have no competing interests to declare.
References
1. Tayefi M, Ngo P, Chomutare T, Dalianis H, Salvi E, Budrionis A, Godtliebsen F. Challenges and opportunities beyond structured data in analysis of electronic health records. WIREs Comput Stat. 2021; 13: e1549.
2. Muehlenbein CE, Hoverman JR, Gruschkus SK, et al. Evaluation of the reliability of electronic medical record data in identifying comorbid conditions among patients with advanced non-small cell lung cancer. J Cancer Epidemiol. 2011; 2011: 983271.
3. American College of Surgeons. American Joint Committee on Cancer. ACS. [Accessed April 2, 2024]. https://www.fACS.org/quality-programs/cancer-programs/american-joint-committee-on-cancer/cancer-staging-systems/.
4. ECOG-ACRIN Cancer Research Group. ECOG performance status. ECOG-ACRIN Cancer Research Group. [Accessed April 2, 2024]. https://ecog-acrin.org/resources/ecog-performance-status/
5. National Palliative Care Research Center. Karnofsky performance scale. NPCRC. [Accessed April 2, 2024]. http://www.NPCRC.org/files/news/karnofsky_performance_scale.pdf.
6. US Department of Health and Human Services. Enhancing the diversity of clinical trial populations: eligibility criteria, enrollment practices, and trial designs. Silver Spring, MD: Center for Drug Evaluation and Research; November 2020. [Accessed April 2, 2024] Available from: https://collections.nlm.nih.gov/catalog/nlm:nlmuid-9918249008406676-pdf.
7. American Cancer Society. What does a clinical trial involve? American Cancer Society. [Accessed April 2, 2024]. https://www.cancer.org/cancer/managing-cancer/making-treatment-decisions/clinical-trials/what-you-need-to-know/what-does-a-clinical-trial-involve.html
8. Jin S, Pazdur R, Sridhara R. Re-evaluating eligibility criteria for oncology clinical trials: analysis of investigational new drug applications in 2015. J Clin Oncol. 2017; 35(33): 3745–3752.
9. Sun W, Cai Z, Li Y, Liu F, Fang S, Wang G. Data processing and text mining technologies on electronic medical records: a review. J Healthc Eng. April 8 2018; 2018: 4302425.
10. Liao KP, Cai T, Savova GK, Murphy SN, Karlson EW, Ananthakrishnan AN, et al. Development of phenotype algorithms using electronic medical records and incorporating natural language processing. BMJ. 2015; 350: h1885.
11. Shreve JT, Khanani SA, Haddad TC. Artificial intelligence in oncology: current capabilities, future opportunities, and ethical considerations. Am Soc Clin Oncol Educ Book. 2022; 42: 842–851.
12. Assale M, Dui LG, Cina A, Seveso A, Cabitza F. The revival of the notes field: leveraging the unstructured content in electronic health records. Front Med. 2019; 6: 66.
13. Cohen AB, Rosic A, Harrison K, Richey M, Nemeth S, Ambwani G, Miksad R, Haaland B, Jiang C. A natural language processing algorithm to improve completeness of ECOG performance status in real-world data. Applied Sciences. 2023; 13(10):6209.
14. AAIAbdulsalam AK, Garvin JH, Redd A, Carter ME, Sweeny C, Meystre SM. Automated extraction and classification of cancer stage mentions fromunstructured text fields in a central cancer registry. AMIA Jt Summits Transl Sci Proc. 2018; 2017: 16–25. Published 2018 May 18.
15. Park HJ, Park N, Lee JH, et al. Automated extraction of information of lung cancer staging from unstructured reports of PET-CT interpretation: natural language processing with deep-learning. BMC Med Inform Decis Mak. 2022; 22: 229.
16. Nguyen AN, Lawley MJ, Hansen DP, et al. Symbolic rule-based classification of lung cancer stages from free-text pathology reports. J Am Med Inform Assoc. 2010; 17(4): 440–445.
17. McCowan IA, Moore DC, Nguyen AN, et al. Collection of cancer stage data by classifying free-text medical reports. J Am Med Inform Assoc. 2007; 14(6): 736–745.
18. Karnofsky DA, Abelmann WH, Craver LF, Burchenal JH. The use of the nitrogen mustards in the palliative treatment of carcinoma. With particular reference to bronchogenic carcinoma. Cancer. 1948; 1(4): 634–656.
19. Abedian S, Sholle ET, Adekkanattu PM, Cusick MM, Weiner SE, Shoag JE, Hu JC, Campion TR Jr. Automated extraction of tumor staging and diagnosis information from surgical pathology reports. JCO Clin Cancer Inform. 2021;5.
20. Huang J, Yang DM, Rong R, et al. A critical assessment of using ChatGPT for extracting structured data from clinical notes. NPJ Digit Med. 2024; 7(1): 106.
21. Ji Z, Lee N, Frieske R, et al. Survey of hallucination in natural language generation. ACM Computing Surveys. 2023; 55(12): 1–38.
22. Farquhar S, Kossen J, Kuhn L, et al. Detecting hallucinations in large language models using semantic entropy. Nature. 2024; 630: 625–630.
23. Freeman SJ, Aly AM, Kataoka MY, Addley HC, Reinhold C, Sala E. The revised FIGO staging system for uterine malignancies: implications for MR imaging. Radiographics. 2012; 32(6): 1805–1827.
24. Edge SB, Byrd DR, Compton CC, Fritz AG, Greene FL, Trotti A. (eds.) AJCC Cancer Staging Manual. 7th ed. New York, NY: Springer; 2010.
25. Zhang G, Jin Q, Zhou Y, et al. Closing the gap between open source and commercial large language models for medical evidence summarization. NPJ Digit Med. 2024; 7:239.