

Introduction
Patient location data is both highly sensitive due to privacy concerns and highly valuable for research due to the influence of location on one’s health.1 Neighborhood-level social determinants of health (SDOH), such as poverty percentages and unemployment rates, are known to influence health outcomes and access to healthcare.234 Location and SDOH are also relevant for research studies on healthcare utilization as location impacts the supply, demand, and need for healthcare resources.4 Research suggests that a person’s zip code may be more relevant to health outcomes than their genetic code.5678 A significant relationship exists between an individual’s zip code, income, and likelihood of trauma or unintentional injury.5 Chicago had a higher number of hot spots of COVID-19-related deaths in neighborhoods with higher numbers of racial or ethnic minority residents.9 Significant differences in life expectancy are observed across neighborhoods with different racial demographics that are just a few miles apart, and partnerships between policy makers, healthcare providers, and researchers are needed to overcome these health disparities.6 Clinical data warehouses play a large role in this multi-pronged approach, in which environmental SDOH data, such as those publicly available from the US Census Bureau, are not necessarily available in the electronic health record but may be derived from patient addresses via geocoding and distributed to researchers and care providers.10,11
Patient addresses are prohibited from being improperly shared due to privacy protections mandated by the Health Insurance Portability and Accountability Act of 1996 (HIPAA). HIPAA’s “Safe Harbor” policy lists 18 data element types, such as names and social security numbers, that must be removed to de-identify a data set for it to be free of patient protected health information; as a consequence, this de-identified data set contains less information and may have less utility.12 For the release of a patient’s geographic region, HIPAA requires a minimum population of at least 20,000 people per geographical unit and specifically names zip code as the smallest permissible area; this rule is a source of confusion, and many interpret it as only being able to release the first three digits of a zip code.13 Aggregating to the first three digits increases the area covered and consequently increases the population. Adding to this confusion, new zip codes are created each year, and some may change over time. Between 2004 and 2022, there were only 13 three-digit zip codes in the United States that were small enough to fall below the threshold of 20,000 people.12,13 De-identified data is freely sharable because of their inherit lack of protected health information, although there is still risk of re-identification.14 Unlike protected health information, data that describes environmental SDOH for a given geographic region is publicly available and can be appropriately integrated into research projects. In a previous study, specific to a population living with substance use disorders, we linked geocoded patient addresses to reference spatial data on socioeconomic advantage, economic mobility, urban core opportunity, and mixed immigrant cohesion and accessibility; we observed significant differences between those with stimulant use disorder, opioid use disorder, and those with both.15
Patients may consent to have their protected health information shared with research studies, or institutional review boards may allow access to identifiable information for secondary data use if the proposed research poses minimal risk to the patients. Many academic medical centers have clinical data warehouses that support operations, research, and translational science goals.16,17 Warehouse teams are typically part of the covered entity under HIPAA and can therefore operate directly with protected health information; this information originates from electronic health records and is ultimately stored in clinical data warehouses for a variety of purposes. We view integration of GIS expertise as a means to enhance the science of clinical data management;18 raw geospatial data is refinable into useful and sharable research data. This article outlines how geographic information systems (GIS) are pivotal for processing patient address data to support a variety of geospatial analytic tasks, such as deriving neighborhood-level SDOH by linking publicly available data to geocoded patient data.
Background
GIS tools are designed to create, store, manipulate, and analyze geographic data.19 Like many data-driven fields, the delineation of GIS as a tool (“geographic information systems”) or as a science (“geographic information science”) is an important distinction for research and GIScience as a scientific discipline has matured.19202122 GIS is important for healthcare as it helps us understand spatial relationships between patients, providers, and healthcare organizations.23 Furthermore, there is evidence that address data is useful for clinical data warehouses in supporting secondary use for research.10,11,24
The most common spatial data elements in clinical data warehouses are patient addresses, although locations of hospitals, clinics, pharmacies, or other ancillary services may also be relevant. Patient address data is typically semi-structured data that originate from the electronic health record; it usually contains two address lines for street, a city, a state, and a zip code. Advanced electronic health record systems may also have latitude and longitude coordinates to represent the address as a point on Earth. If the coordinates are not available in the source system, they may be calculated by processing the semi-structured address data with GIS tools.
Geocoding is the process of translating raw address data into geographic coordinates, such as latitude and longitude. As a result of the sensitive and protected nature of addresses, care must be taken in what GIS strategy is used to geocode the raw data. There are three types of geocoding strategies: “in-house” geocoding, geocoding web-services, and pass-through cloud services.25 “In-house” geocoding refers to any GIS solution deployed behind an institution’s firewall, where protected health information must remain. Geocoding web-services refer to any web-based GIS solution that offers an application programming interface (API) that provides GIS functionality; because sensitive data is shared across entities, these APIs require a business associates agreement (BAA) that outline data sharing permissions and compliance measures. Pass-through cloud services refer to leveraging existing BAAs for institutions that are already a customer of a cloud-based provider, such as Azure and Amazon; the privacy protections are already accounted for by the original cloud-based agreement. For this paper, we focus on “in-house” geocoding as complementary infrastructure to an “in-house” clinical data warehouse. Our local warehouse is on-premises, and cost eliminated the viability of using geocoding APIs due to their charge-per-address request model. Furthermore, we focus on open-source technology to minimize the financial impact of adding GIS-related services to clinical data warehouses.
PostgreSQL is a freely available database management system and is popular in open-source projects.26 PostgreSQL has been shown to outperform competing platforms for geospatial tasks.27 PostGIS is an open-source extension for PostgreSQL that provides many foundational geospatial capabilities, such as storing spatial data, calculating distances, and intersecting points within geographic regions. We previously demonstrated that PostgreSQL with PostGIS outperformed a competing open-source geocoding tool, OpenStreetMap’s Nominatim.11 Our bench4gis tool enabled benchmarking of GIS performance by using big open data as reference data in which the local calculated coordinates can be compared to the coordinates in the source data.11 Using bench4gis, we determined that the accuracy of open-source geocoding was adequate for our data warehouse’s analytical needs.11
Methods
We deployed PostGIS to a physical PostgreSQL database server hosted in our enterprise data center; this “in-house” GIS resource is housed behind our private firewall where identified data is stored. We selected the PostGIS TIGER Geocoder which pulls its geospatial reference data from the US Census Bureau’s TIGER (Topologically Integrated Geographic Encoding and Referencing) database.28 This reference data defines geographies used by the US Census Bureau and also was used as part of our geocoding process. We developed procedures for geocoding our patient table using PL/pgSQL, the programming language used by PostGIS and PostgreSQL.
We developed and automated extract, transform, and load (ETL) jobs that import patient address data from our warehouse, process the addresses with PostGIS to get coordinates (EPSG:4326) and other important geospatial features, and export the results back to the warehouse. This is visualized in Figure 1. We stored the results as part of the warehouse so that our team of data analysts could handle data requests from researchers and share our derived SDOH. One of the largest benefits of PostGIS is that it is database-driven; all methods and all spatial data can be used to create reusable queries that can be automated, which is necessary for live data systems that need to be maintained and updated with the most recent data. The ETL processes in Figure 1 require staff to be familiar with both database systems. TIGER reference data is updated yearly, which requires data management overhead for maintaining the most current data; because of this yearly lag, performance may vary in rapidly developing locations or locations that have undergone critical infrastructure changes. We learned that preprocessing is needed because of the noisy, unexpected characters that occasionally occur in address data.
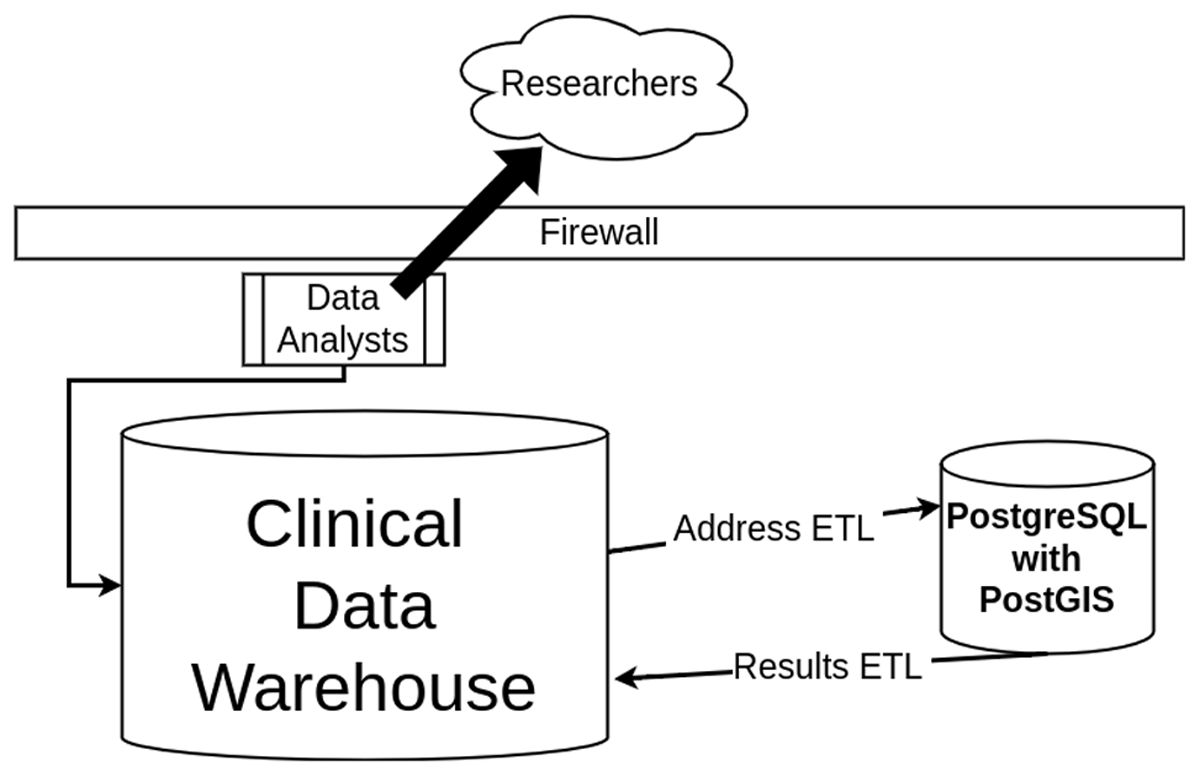
Clinical data warehouse augmented by GIS services.
As a preprocessing step, addresses are cleaned to correct commonly observed mistakes such as removing the names of businesses or apartment complexes in the first address line; our geocoder expected only street addresses as input. We also censor certain special characters that PostGIS uses for pattern matching. Our geocoding routine automatically normalizes addresses as part of the geocoding process, such as enforcing consistent capitalization of addresses and consistent abbreviation of street types (“Street” vs “St”, “Avenue” vs “Ave”, etc).
A series of data points are derived for each address as outlined in Figure 2. The semi-structured, normalized address is geocoded to derive latitude and longitude coordinates. The geocode function is part of PostGIS and it returns a list of potential points that match the address; since each result is rated, we simply take the point with the highest rating. We store the address data, matched coordinates, and rating in our warehouse, where most analytical tasks use results with ratings in the top quartile. Our ratings are reported in Table 1. The geocoded results with coordinates also contain computed city, state, zip code, and county from a spatial join with the TIGER reference data. Our electronic health records contained fields for county and zip code, but the utility of these was questionable due to many of them being blank or inconsistent with the recorded city. However, we can use what fields are present in the address data to partially validate our geocoding processes by comparing the individual components of the address and the geocoded results, such as comparing the original address’s city to the geocoded city. The derived city, state, zip code, and county are guaranteed to match the latitude and longitude of our computed point. There is natural error associated with geocoding; most matches are not exact due to nuances and variations in how addresses are recorded. The derived data points will at least be consistent with our calculated point; for example, a patient’s county or zip code will always match the county or zip code associated with the coordinates generated.
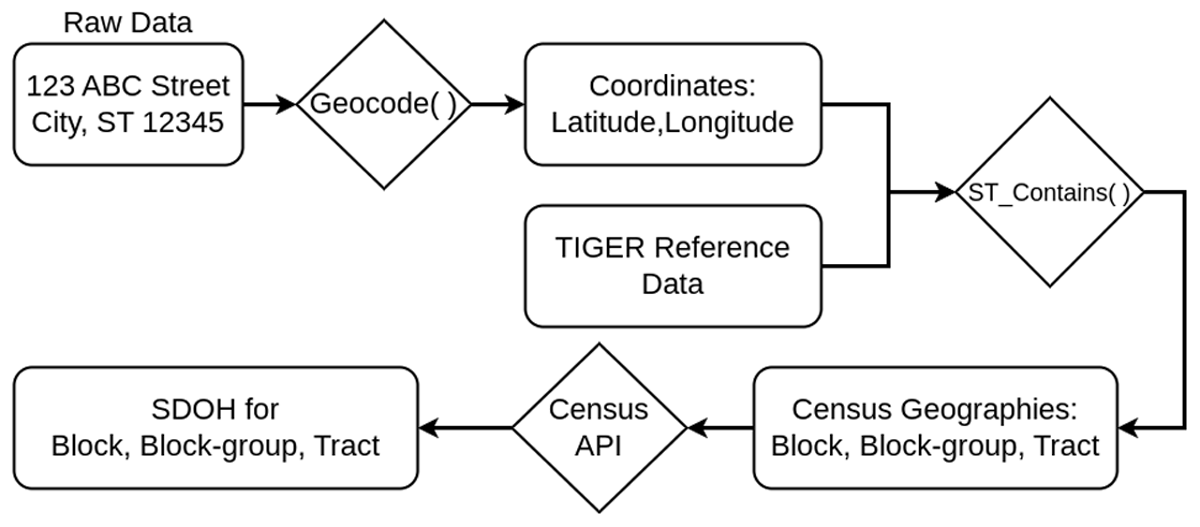
Geocoding raw address data and linking to census data.
Observed geocode ratings.
| Rating | Unique Records | Percent of Total |
| –1 (no result) | 35,120 | 2.6 |
| 0 (perfect) | 414,623 | 30.4 |
| <10 | 809,131 | 59.2 |
| <25 | 962,814 | 70.5 |
| <50 | 1,055,123 | 77.2 |
| <75 | 1,124,814 | 82.3 |
In addition to generating county and zip code, we intersected our coordinates with US Census Bureau geographies such as block, block-group, and tract, by using PostGIS’s ST_Contains function to join to the geographic region that contains the geocoded point. By design, blocks are the smallest geographic unit and contain 600 to 3,000 people, while tracts are the largest of the three and have a population of 1,200 to 8,000 people.29 This linkage to block, block-group, and tract geographies enabled us to extract neighborhood-level SDOH collected by the US Census Bureau. The US Census Bureau conducts nation-wide surveys such as the Decennial Census and the yearly American Community Survey (ACS).30 We leveraged the Census Bureau’s API to extract reference data for the 2020 ACS 5-year estimates that correspond to our geographic regions. For every variable, we extracted estimates for totals, percentages, and margin of error for all geographies (county, zip code, tract, block-group, and block where available). Linking our patient data to this reference data was as simple as a database join in PostGIS, where the patient’s region matches the reference data’s region. Many of these variables are estimates for the percentage of population having a specific status, such as unemployed, living under the poverty rate, or specific race breakdowns. We further obfuscated the original percentage by binning similar thresholds when reporting or aggregating. For example, we grouped those living in areas of 0–5% unemployment when aggregating below-average unemployment rates.
Our research data warehouse supports clinical and translational science on campus, and addressing health disparities plays a large role in our Center for Clinical and Translational Sciences. Given the local emphasis on health disparities and the complex socioeconomic history of Kentucky, we chose the following variables: unemployment rate; poverty rates for anyone, families specifically, children only, and adults only; education rates of high school degrees or bachelor’s degrees; veteran rates; rates of access to the internet; one race percentages for White, Black, Asian, American Indian/Alaskan Native, and other, multi-race percentages for two or more races, and percentage Hispanic or Latino of any race. These variables were chosen either for their direct relationship with the socioeconomic status of a region or for their correspondence to neighborhood race demographics, which is linked to disparities in health outcomes.6,9
Results
An exemplary run of our GIS pipeline processed addresses corresponding to 1,366,010 patients. Each geocoded result is rated 0 (perfect) to 100 (imperfect); this number represents the difference between the input address and the computed matched address in the reference data, in which 0 implies the reference address matched perfectly in the spirit of a string edit distance. The average rating for our example run was 27.9 with a median of 8.0, which indicated addresses were confidently geocoded. 70.5 percent of our records were geocoded with a rating of 25 or less, indicating most records were successfully geocoded.
Table 1 summarizes the ratings observed for our 1,366,010 patients for the best address match. A rating of –1 indicated the address could not be geocoded (2.6% of our records) and these either correspond to post office boxes, which have no geospatial interpretation, or addresses that were poorly formatted, erroneous, or non-existent (“unknown”, “homeless”, etc.). Despite often missing complete address data, we previously demonstrated that unhoused patients and those who have experienced housing instability may be partially identifiable using address data;31 however, many of these individuals would fall into the 2.6% that could not be geocoded.
Those records with ratings higher than 50 have poor geographic resolution and are often just centers of cities corresponding to the address, which limits their utility. These imperfect results may be adequate for county-level or zip-code analyses, depending on local geography. For specific studies supported by our warehouse that leverage a smaller population, we can manually review and clean addresses with the goal of improving geocoding; this manual process scales poorly so we do not review matches for our entire warehouse.
Our linkage to neighborhood demographics from the ACS is summarized in Table 2 for a selection of important variables and by binning the results. Each patient lives in a neighborhood with a specific percentage that corresponds to an ACS variable. For example, a patient may live in an area known to have 12% unemployment, which would place them in the 10–15% unemployment bin in Table 2 for our population; 8.7% of our patient population lived in regions with unemployment rates of 10–15%. For comparison, in July of 2023, the unemployment rate for the United States was 3.5% and 3.8% for the state of Kentucky, seasonally adjusted.32,33 The bin sizes for Table 2 were selected at every 5% for simplicity and may not reflect the optimal bin sizes for each variable.
Neighborhood demographics and percentage of patients in our data warehouse. For example, 33.8% of our patients live in an area where more than 20% of the population falls below the poverty line.
| Demographic | Mean | SD | Median | Percentage of Patients Per Bin of ACS Estimated Percentages | |||||
| Bin | |||||||||
| 0–5% | 5–10% | 10–15% | 15–20% | >20% | Unknown | ||||
| Unemployment | 5.8% | 5.9 | 5.2% | 45.3% | 40.4% | 8.7% | 4.1% | 1.2%. | <1% |
| Below Poverty | 17.9% | 11.5 | 15.8% | 13.0% | 13.7% | 10.9% | 27.8 | 33.8% | <1% |
| Children Below Poverty | 21.2% | 17.2 | 19.0% | 19.8% | 6.5% | 8.9% | 17.7% | 43.7% | 3.4% |
| Veteran Status | 7.9% | 5.9 | 6.4% | 23.2% | 54.2% | 12.5% | 5.0% | 4.2% | <1% |
| Bachelor’s degree | 24.9% | 16.1 | 21.1% | 7.8% | 8.9% | 13.7% | 14.7% | 53.9% | <1% |
In 2021, Kentucky is ranked 47th for poverty in the United States with a rate of 16.5%.34 Figure 3 shows the population that was captured by our research data warehouse by using quantiles where the darkest blue is the densest concentration of patients. Figure 4 shows the population when filtering for patients living in areas experiencing poverty rates larger than 20%. We only considered patients having geocode ratings of 25 or better to avoid categorizing patients into the wrong census tract. This illustrates that patients living in eastern Kentucky are experiencing the highest rates of poverty. Eastern Kentucky is home to Kentucky’s Appalachian counties, which have a long history of poverty-related issues.
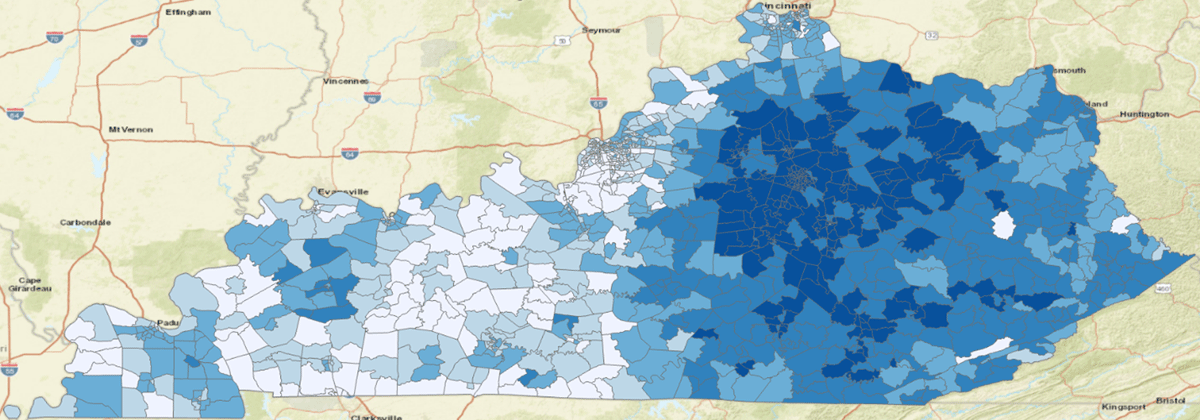
Patients Served by University of Kentucky Healthcare, 2004–2022.
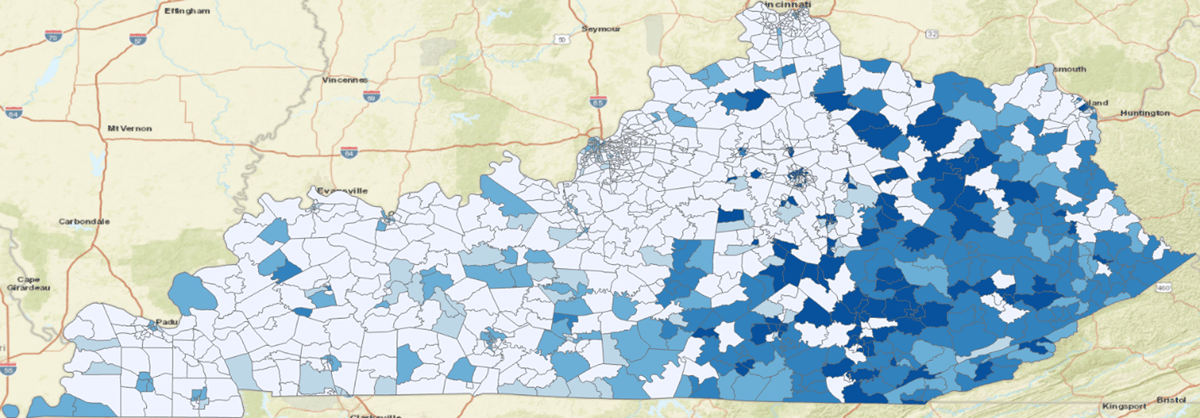
Patients Served by University of Kentucky Health Living In Areas Having Poverty Rates Larger than 20%, 2004–2022.
We also looked at child poverty. 43.7% of our population lived in areas that had more than 20% of children living below the poverty line (21.2% on average for all patients). For comparison, the national poverty rate for children in 2021 was 16.9% and 22.1% for Kentucky.35,36 Some of the patients in this study live in areas where 100% of the children are estimated to live below the poverty line.
We also captured race and ethnicity related variables, which are largely driven by the population served in central Kentucky. The majority of patients lived in areas in which only 0–5% of the population were Black or African American (60.2%) or Hispanic or Latino of any race (62.24%). Conversely, 25.4% of patients lived in areas with more than 10% Black or African American residents; 11.35% lived in areas with more than 10% Hispanic or Latino residents.
Discussion
The incongruence of patient address data being highly sensitive yet highly valuable for research is problematic for warehouses and researchers. The addresses, in their raw form as a collection of characters, are not valuable to biomedical research unless converted to structured data that allows analysis. For this workflow in particular, addresses acted as a means of obtaining and linking to important contextual information about a patient’s well-being, including SDOH. We have demonstrated a HIPPA-compliant workflow in which we deploy GIS tools to aid in the conversion of raw address data into neighborhood-level SDOH by linking to publicly available data. The specific block, block-group, or tract assigned to a person’s address does not need to be shared, which conforms to “Safe Harbor” de-identification practices by avoiding the need to share sub-zip code designations; the resulting linked SDOH data is sharable and is incredibly valuable for research as it enables the analysis of location-based factors with health outcomes. It is not clear how distinct percentage estimates are for a particular geographic region, but binning percentages as seen in Table 2 further obfuscate in what particular area an individual lives. In future work, we wish to explore how unique a particular block, block-group, or tract may be with respect to all of its ACS demographics; the US contains over 8 million block-groups and over 84,000 tracts, which may imply that binning is needed to prevent deducing a person’s geographic region for unaggregated, row-level data.
The National Institutes of Health issued a mandate stating that in January of 2023 research proposals will require a data management plan that outlines a public data sharing strategy.37 Data sharing is currently in the research spotlight due to national research programs that are designed to facilitate the sharing of data, such as All of Us38 and the National COVID Cohort Collaborative (N3C).39 Data sharing is often a cultural or regulatory issue and not a technology problem. We have made great progress locally in informing our institutional review board of how our GIS results operate; in general, the release of patient address data or derived spatial data was not permissible before we invested in GIS infrastructure and expertise. Data sharing is expedited by converting highly sensitive address data to less sensitive environmental SDOH data by geocoding and linking to variables available in reference data; it is possible to share that a person lives in an area that has unemployment rates higher than 20 percent without revealing what region they live in.
As an institution, participation in any large-scale national research program requires a dynamic clinical data warehouse that is capable of meeting ad hoc requests for data and project requirements. We argue that GIS is the component of a clinical data warehouse for research necessary for geospatial computing and sharing of joined spatial data. Furthermore, many clinical data warehouses serve their research community by providing data extracts; we have shown that GIS could improve the utility of the raw address data, and spare other researchers redundant effort in performing their own geocoding. Our GIS data is pushed back into our enterprise’s research data warehouse for researchers to use.
Open-source GIS software minimizes cost and opens the door for adopting other open-source solutions. We created a plugin for PostgreSQL and PostGIS that bridges the gap between a popular data model and differential privacy, where privacy is a tunable parameter.10 Adding geographic coordinates to the data warehouse also enables other geospatial analyses, such as hot spot analysis. Open-source software is an important element in reproducible and equitable science, in which tools are publicly available for all and are not a barrier in research participation or adoption. Commercial software may have a role in addressing a research question, though cost may limit who is capable of licensing these tools thereby preventing equal access to research. If the research question is incompatible with the limitations of open-source options, such as timeliness of spatial reference data, commercial software and cost may be required to generate more accurate results.
This work focused on adding context to patients using location-based SDOH made available by the US Census Bureau. GIS also allows for distance-based contextual information, including highlighting how far away a patient lives from healthcare entities, pharmacies, or other health-related waypoints. These distances may also be obfuscated by adding noise, and binning may also be applicable to create categories of patients based on different distance thresholds. There are several important limitations to our SDOH findings. Results were not integrated into the local electronic medical record, which limits our reach and impact; we focused solely on supporting research by making our GIS data available in our research data warehouse. Our historical patient data from 2004 to 2021 contains only the most recent address data for patients, which implies that we potentially miscategorized a patient’s SDOH if they moved between areas with differing socioeconomic factors. The TIGER reference data for PostGIS is only updated annually, which may impact its accuracy in areas experiencing high levels of development or other critical infrastructure changes. Census and ACS-based variables are estimates with an associated margin of error; these margins of error are reportable and sharable, although it can be difficult for end users to judge the significance or impact of these margins on a research question. Because of this, we urge researchers using healthcare GIS data to be aware of ACS limitations with respect to variation in geography and uncertainty.40,41 The GIS solution explored in this paper is specifically designed to create usable data for analytical purposes; other tools are needed for the analysis component, such as development, visualization, or business intelligence tools.
Conclusions
GIS support is a necessary component of a clinical data warehouse; sharing derived, de-identified data is both feasible and useful for research. Patient address data is heavily protected but also very useful for research purposes, as the addresses may be linked to location-based SDOH that add contextual patient information about their environment. This contextual information is important for health outcomes and is not available anywhere else as part of patient electronic health records. We recommend adopting open-source software as it lowers the barrier of adoption and the cost associated with deriving these contextual data points. We specifically recommend using database-driven GIS tools, such as PostGIS, because they aid in automation. Adding location-based SDOH to clinical data warehouses prevents duplication of effort by centralizing results that may be shared elsewhere. Address-related data is often viewed as data that cannot be shared in any form. We hope to contribute to a culture shift that recognizes that location-based data is sharable in safe and ethical forms; we encourage others to use this work to help justify integrating GIS into local research warehousing efforts.
Appendix
2020 ACS 5-Year Estimates: Concept and Variable Mapping.
| Concept | Variable |
| Unemployment | DP03_0009PE |
| Poverty | DP03_0128PE, DP03_0119PE, DP03_0129PE, DP03_0133PE |
| Education | DP02_0067PE, DP02_0068PE |
| Veteran | DP02_0070PE |
| Access to the Internet | DP02_0154PE |
| Single Race | DP05_0037PE, DP05_0038PE, DP05_0044PE, DP05_0039PE, DP05_0057PE |
| Multi-Race | DP05_0058PE |
| Hispanic or Latino | DP05_0071PE |
Acknowledgements
The project described was supported by the National Institutes of Health National Center for Advancing Translational Sciences through grant number UL1TR001998. The content is solely the responsibility of the authors and does not necessarily represent the official views of the NIH.
Competing Interests
The author has no competing interest to declare.
References
1. Prentice JC. Neighborhood effects on primary care access in Los Angeles. Social Science & Medicine. 2006; 62(5): 1291–1303. DOI: http://doi.org/10.1016/j.socscimed.2005.07.029
2. Bell S, Wilson K, Bissonnette L, Shah T. Access to primary health care: does neighborhood of residence matter? Annals of the Association of American Geographers. 2013; 103(1): 85–105. DOI: http://doi.org/10.1080/00045608.2012.685050
3. Hussein M, Roux AVD, Field RI. Neighborhood socioeconomic status and primary health care: usual points of access and temporal trends in a major US urban area. Journal of Urban Health. 2016; 93(6): 1027–1045. DOI: http://doi.org/10.1007/s11524-016-0085-2
4. Mohnen SM, Schneider S, Droomers M. Neighborhood characteristics as determinants of healthcare utilization–a theoretical model. Health Econ Rev. 2019; 9(1): 1–9. DOI: http://doi.org/10.1186/s13561-019-0226-x
5. Elkbuli A, Sanchez C, Boneva D, Hai S, McKenney M. Zip code–targeted injury prevention community outreach initiatives: zip code is as Important as genetic code. The American Surgeon. 2019; 85(11): 546–548. DOI: http://doi.org/10.1177/000313481908501113
6. Graham GN. Why your ZIP code matters more than your genetic code: promoting healthy outcomes from mother to child. Breastfeed Med. 2016; 11(8): 396–397. DOI: http://doi.org/10.1089/bfm.2016.0113
7. Ritchie D. Our zip code may be more important than our genetic code: social determinants of health, law and policy. R I Med J. 2013; 96: 14–14.
8. Slade-Sawyer P. Is health determined by genetic code or zip code? Measuring the health of groups and improving population health. N C Med J. 2014; 75(6): 394–397. DOI: http://doi.org/10.18043/ncm.75.6.394
9. Pierce JB, Harrington K, McCabe ME, et al. Racial/ethnic minority and neighborhood disadvantage leads to disproportionate mortality burden and years of potential life lost due to COVID-19 in Chicago, Illinois. Health Place. 2021; 68: 102540. DOI: http://doi.org/10.1016/j.healthplace.2021.102540
10. Harris DR. Leveraging differential privacy in geospatial analyses of standardized healthcare data. In: 2020 IEEE International Conference on Big Data (Big Data). IEEE; 2020: 3119–3122. DOI: http://doi.org/10.1109/BigData50022.2020.9378390
11. Harris DR, Delcher C. bench4gis: Benchmarking privacy-aware geocoding with open big data. In: 2019 IEEE International Conference on Big Data (Big Data). IEEE; 2019: 4067–4070. DOI: http://doi.org/10.1109/BigData47090.2019.9006234
12. Clause SL, Triller DM, Bornhorst CPH, Hamilton RA, Cosler LE. Conforming to HIPAA regulations and compilation of research data. American Journal of Health-System Pharmacy. 2004; 61(10): 1025–1031. DOI: http://doi.org/10.1093/ajhp/61.10.1025
13. Krzyzanowski B, Manson SM. Twenty years of the Health Insurance Portability and Accountability Act Safe Harbor Provision: unsolved challenges and ways forward. JMIR Med Inform. 2022; 10(8): e37756. DOI: http://doi.org/10.2196/37756
14. Benitez K, Malin B. Evaluating re-identification risks with respect to the HIPAA privacy rule. Journal of the American Medical Informatics Association. 2010; 17(2): 169–177. DOI: http://doi.org/10.1136/jamia.2009.000026
15. Delcher C, Harris DR, Anthony N, Stoops WW, Thompson K, Quesinberry D. Substance use disorders and social determinants of health from electronic medical records obtained during Kentucky’s “triple wave.” Pharmacology Biochemistry and Behavior. Published online November 22, 2022: 173495. DOI: http://doi.org/10.1016/j.pbb.2022.173495
16. Campion TR Jr, Craven CK, Dorr DA, Knosp BM. Understanding enterprise data warehouses to support clinical and translational research. Journal of the American Medical Informatics Association. 2020; 27(9): 1352–1358. DOI: http://doi.org/10.1093/jamia/ocaa089
17. Knosp BM, Craven CK, Dorr DA, Bernstam EV, Campion TR Jr. Understanding enterprise data warehouses to support clinical and translational research: enterprise information technology relationships, data governance, workforce, and cloud computing. Journal of the American Medical Informatics Association. 2022; 29(4): 671–676. DOI: http://doi.org/10.1093/jamia/ocab256
18. Banach MA, Fendt KH, Proeve J, Plummer D, Qureshi S, Limaye N. Clinical data management in the United States: where we have been and where we are going. Journal of the Society for Clinical Data Management. 2022; 1(3). DOI: http://doi.org/10.47912/jscdm.61
19. Gold CM. What is GIS and what is not? Transactions in GIS. 2006; 10(4): 505–519. DOI: http://doi.org/10.1111/j.1467-9671.2006.01009.x
20. Goodchild M. Twenty years of progress: GIScience in 2010. Journal of Spatial Information Science. 2010; 1: 3–20. DOI: http://doi.org/10.5311/JOSIS.2010.1.2
21. Wright DJ, Goodchild MF, Proctor JD. Demystifying the persistent ambiguity of GIS as ‘tool’ versus ‘science.’ Annals of the Association of American Geographers. 1997; 87(2): 346–362. DOI: http://doi.org/10.1111/0004-5608.872057
22. Lü G, Batty M, Strobl J, Lin H, Zhu AX, Chen M. Reflections and speculations on the progress in Geographic Information Systems (GIS): a geographic perspective. International Journal of Geographical Information Science. 2019; 33(2): 346–367. DOI: http://doi.org/10.1080/13658816.2018.1533136
23. McLafferty SL. GIS and health care. Annu Rev Public Health. 2003; 24(1): 25–42. DOI: http://doi.org/10.1146/annurev.publhealth.24.012902.141012
24. Vest JR, Kasthurirathne SN, Ge W, Gutta J, Ben-Assuli O, Halverson PK. Choice of measurement approach for area-level social determinants of health and risk prediction model performance. Informatics for Health and Social Care. 2022; 47(1): 80–91. DOI: http://doi.org/10.1080/17538157.2021.1929999
25. Rivera B, Hoffman M. Technical strategies for real-time geocoding in healthcare. In: 2018 IEEE International Smart Cities Conference (ISC2). IEEE; 2018: 1–5. DOI: http://doi.org/10.1109/ISC2.2018.8656931
26. PostgreSQL Global Development Group. PostgreSQL: the world’s most advanced open-source database. Published online 2022. Accessed August 31, 2023. https://www.postgresql.org/
27. Makris A, Tserpes K, Spiliopoulos G, Zissis D, Anagnostopoulos D. MongoDB vs PostgreSQL: a comparative study on performance aspects. Geoinformatica. 2021; 25(2): 243–268. DOI: http://doi.org/10.1007/s10707-020-00407-w
28. Refractions Research. PostGIS: spatial and geographic objects for PostgreSQL. Published online 2022. Accessed August 31, 2023. https://postgis.net
29. US Census Bureau. Glossary. Published online 2022. Accessed August 31, 2023. https://www.census.gov/programs-surveys/geography/about/glossary.html
30. US Census Bureau. American Community Survey (ACS). Published online 2022. Accessed August 31, 2023. https://www.census.gov/programs-surveys/acs
31. Harris, D, Anthony, N, Quesinberry, D, Delcher, C. Evidence of housing instability identified by addresses, clinical notes, and diagnostic codes in a real-world population with substance use disorders. Journal of Clinical and Translational Sciences. Published online August 29, 2023; 1–23. DOI: http://doi.org/10.1017/cts.2023.626
32. US Bureau of Labor Statistics. Kentucky economy at a glance. Accessed August 31, 2023. https://www.bls.gov/eag/eag.ky.htm
33. US Bureau of Labor Statistics. United States economy at a glance. Accessed August 31, 2023. https://www.bls.gov/eag/eag.us.htm
34. Center for American Progress. Poverty in the United States: explore the map. Published September 19, 2022. Accessed September 1, 2023. https://www.americanprogress.org/data-view/poverty-data/poverty-data-map-tool/
35. Benson C. Poverty rate of children higher than national rate, lower for older populations. United States Census Bureau. Published October 4, 2022. Accessed September 1, 2023. https://www.census.gov/library/stories/2022/10/poverty-rate-varies-by-age-groups.html
36. Cash K. The latest trends in child poverty and health insurance. Kentucky Youth Advocates. Published September 21, 2022. Accessed September 1, 2023. https://kyyouth.org/the-latest-trends-in-child-poverty-and-health-insurance/
37. Kozlov M. NIH issues a seismic mandate: share data publicly. Nature. 2022; 602(7898): 558–559. DOI: http://doi.org/10.1038/d41586-022-00402-1
38. Ramirez AH, Sulieman L, Schlueter DJ, et al. The All of Us Research Program: data quality, utility, and diversity. Patterns. 2022; 3(8): 100570. DOI: http://doi.org/10.1016/j.patter.2022.100570
39. Bennett TD, Moffitt RA, Hajagos JG, et al. Clinical characterization and prediction of clinical severity of SARS-CoV-2 infection among US adults using data from the US National COVID Cohort Collaborative. JAMA network open. 2021; 4(7): e2116901–e2116901. DOI: http://doi.org/10.1001/jamanetworkopen.2021.16901
40. Spielman SE, Folch D, Nagle N. Patterns and causes of uncertainty in the American Community Survey. Applied Geography. 2014; 46: 147–157. DOI: http://doi.org/10.1016/j.apgeog.2013.11.002
41. Folch DC, Arribas-Bel D, Koschinsky J, Spielman SE. Spatial variation in the quality of american community survey estimates. Demography. 2016; 53(5): 1535–1554. DOI: http://doi.org/10.1007/s13524-016-0499-1